Classmates.com 2011 Annual Report Download - page 85
Download and view the complete annual report
Please find page 85 of the 2011 Classmates.com annual report below. You can navigate through the pages in the report by either clicking on the pages listed below, or by using the keyword search tool below to find specific information within the annual report.-
 1
1 -
2
-
3
-
4
-
5
-
6
-
7
-
8
-
9
-
10
-
11
-
12
-
13
-
14
-
15
-
16
-
17
-
18
-
19
-
20
-
21
-
22
-
23
-
24
-
25
-
26
-
27
-
28
-
29
-
30
-
31
-
32
-
33
-
34
-
35
-
36
-
37
-
38
-
39
-
40
-
41
-
42
-
43
-
44
-
45
-
46
-
47
-
48
-
49
-
50
-
51
-
52
-
53
-
54
-
55
-
56
-
57
-
58
-
59
-
60
-
61
-
62
-
63
-
64
-
65
-
66
-
67
-
68
-
69
-
70
-
71
-
72
-
73
-
74
-
 75
75 -
 76
76 -
 77
77 -
 78
78 -
 79
79 -
 80
80 -
 81
81 -
 82
82 -
 83
83 -
 84
84 -
 85
85 -
 86
86 -
 87
87 -
 88
88 -
 89
89 -
 90
90 -
 91
91 -
 92
92 -
 93
93 -
 94
94 -
 95
95 -
96
-
97
-
98
-
99
-
100
-
101
-
102
-
103
-
104
-
105
-
106
-
107
-
108
-
109
-
110
-
111
-
112
-
113
-
114
-
115
-
116
-
117
-
118
-
119
-
120
-
121
-
122
-
123
-
124
-
125
-
126
-
127
-
128
-
129
-
130
-
131
-
132
-
133
-
134
-
135
-
136
-
137
-
138
-
139
-
140
-
141
-
142
-
143
-
144
-
145
-
146
-
147
-
148
-
149
-
150
-
151
-
152
-
153
-
154
-
155
-
156
-
157
-
158
-
159
-
160
-
161
-
162
-
163
-
164
-
165
-
166
-
167
-
168
-
169
-
170
-
171
-
172
 |
 |

Table of Contents
Year Ended December 31, 2010 compared to Year Ended December 31, 2009
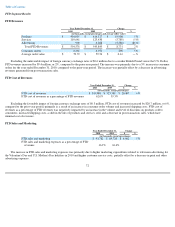
Net cash provided by operating activities decreased by $19.7 million, or 12%, for the year ended December 31, 2010, compared to the year
ended December 31, 2009. Net cash provided by operating activities is driven by our net income adjusted for changes in working capital and
non-cash items, including, but not limited to, depreciation and amortization, stock-based compensation, impairment of goodwill, intangible
assets and long-lived assets, deferred taxes, and tax benefits (shortfalls) from equity awards. Net income, adjusted for non-cash items, decreased
by $22.1 million to $148.4 million for the year ended December 31, 2010, compared to the prior-year period. The decrease was offset by a
$2.4 million increase in the change in working capital for the year ended December 31, 2010, compared to the prior-year period.
Net cash used for investing activities increased by $5.6 million, or 21%, for the year ended December 31, 2010, compared to the year ended
December 31, 2009. The increase was due to $4.7 million in purchases of rights, content and intellectual property related to acquiring new
content for our domestic online nostalgia services business and a $1.1 million increase in capital expenditures.
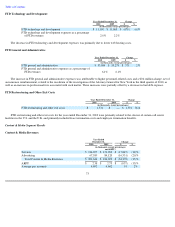
Net cash used for financing activities decreased by $2.9 million, or 2%, for the year ended December 31, 2010, compared to the year ended
December 31, 2009. The decrease in net cash used for financing activities was primarily due to a decrease in debt payments of $15.3 million, an
increase in proceeds from the exercise of stock options and proceeds from the employee stock purchase plans of $1.5 million, and an increase in
excess tax benefits from equity awards of $0.5 million. The decrease was partially offset by an increase in common stock repurchases of
$13.7 million, including $11.0 million under our common stock repurchase program, and an increase in the payment of dividends and dividend
equivalents of $0.7 million for the year ended December 31, 2010, compared to the prior-year period.
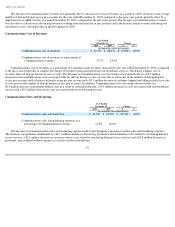
Contractual Obligations
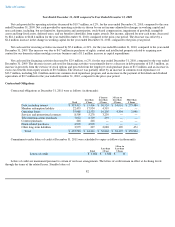
Contractual obligations at December 31, 2011 were as follows (in thousands):
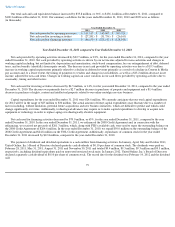
Commitments under letters of credit at December 31, 2011 were scheduled to expire as follows (in thousands):
Letters of credit are maintained pursuant to certain of our lease arrangements. The letters of credit remain in effect at declining levels
through the terms of the related leases. Standby letters of
82
Total
Less than
1 Year
1 Year to
Less than
3 Years
3 Years to
Less than
5 Years
More than
5 Years
Debt, including interest
$
353,415
$
15,406
$
30,524
$
34,001
$
273,484
Member redemption liability
22,453
17,934
4,519
—
—
Operating leases
35,988
12,533
16,205
4,304
2,946
Services and promotional contracts
8,509
5,270
3,239
—
—
Telecommunications purchases
7,022
6,729
293
—
—
Content purchases
218
218
—
—
—
Floral
-
related purchases
4,999
4,999
—
—
—
Other long
-
term liabilities
2,979
227
2,088
190
474
Total
$
435,583
$
63,316
$
56,868
$
38,495
$
276,904
Total
Less than
1 Year
1 Year to
Less than
3 Years
Letters of credit
$
1,604
$
1,588
$
16