Classmates.com 2011 Annual Report Download - page 65
Download and view the complete annual report
Please find page 65 of the 2011 Classmates.com annual report below. You can navigate through the pages in the report by either clicking on the pages listed below, or by using the keyword search tool below to find specific information within the annual report.-
 1
1 -
2
-
3
-
4
-
5
-
6
-
7
-
8
-
9
-
10
-
11
-
12
-
13
-
14
-
15
-
16
-
17
-
18
-
19
-
20
-
21
-
22
-
23
-
24
-
25
-
26
-
27
-
28
-
29
-
30
-
31
-
32
-
33
-
34
-
35
-
36
-
37
-
38
-
39
-
40
-
41
-
42
-
43
-
44
-
45
-
46
-
47
-
48
-
49
-
50
-
51
-
52
-
53
-
54
-
 55
55 -
 56
56 -
 57
57 -
 58
58 -
 59
59 -
 60
60 -
 61
61 -
 62
62 -
 63
63 -
 64
64 -
 65
65 -
 66
66 -
 67
67 -
 68
68 -
 69
69 -
 70
70 -
 71
71 -
 72
72 -
 73
73 -
 74
74 -
 75
75 -
76
-
77
-
78
-
79
-
80
-
81
-
82
-
83
-
84
-
85
-
86
-
87
-
88
-
89
-
90
-
91
-
92
-
93
-
94
-
95
-
96
-
97
-
98
-
99
-
100
-
101
-
102
-
103
-
104
-
105
-
106
-
107
-
108
-
109
-
110
-
111
-
112
-
113
-
114
-
115
-
116
-
117
-
118
-
119
-
120
-
121
-
122
-
123
-
124
-
125
-
126
-
127
-
128
-
129
-
130
-
131
-
132
-
133
-
134
-
135
-
136
-
137
-
138
-
139
-
140
-
141
-
142
-
143
-
144
-
145
-
146
-
147
-
148
-
149
-
150
-
151
-
152
-
153
-
154
-
155
-
156
-
157
-
158
-
159
-
160
-
161
-
162
-
163
-
164
-
165
-
166
-
167
-
168
-
169
-
170
-
171
-
172
 |
 |

Table of Contents
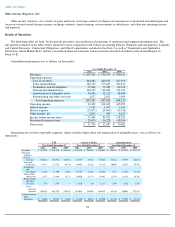
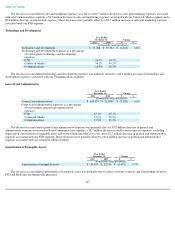
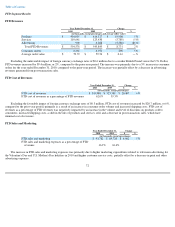
Provision for Income Taxes
The decrease in the effective income tax rate was primarily due to the benefit of higher year-over-year discrete income tax benefits and
reduced expense related to lower non-deductible stock-based compensation.
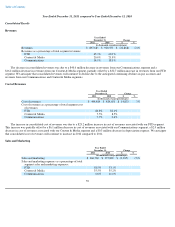
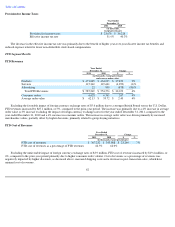
FTD Segment Results
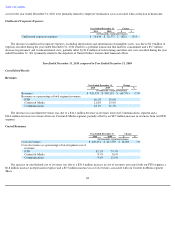
FTD Revenues
Excluding the favorable impact of foreign currency exchange rates of $5.6 million due to a stronger British Pound versus the U.S. Dollar,
FTD revenues increased by $27.1 million, or 5%, compared to the prior-year period. The increase was primarily due to a 4% increase in average
order value (a 3% increase excluding the impact of foreign currency exchange rates) for the year ended December 31, 2011, compared to the
year ended December 31, 2010 and a 4% increase in consumer orders. The increase in average order value was driven primarily by increased
merchandise values, partially offset by higher discounts, primarily related to group-buying initiatives.
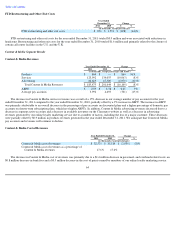
FTD Cost of Revenues
Excluding the unfavorable impact of foreign currency exchange rates of $3.9 million, FTD cost of revenues increased by $19.4 million, or
6%, compared to the prior-year period primarily due to higher consumer order volume. Cost of revenues as a percentage of revenues was
negatively impacted by higher discounts, as discussed above, increased shipping costs and a decrease in post-transaction sales, which have
minimal cost of revenues.
62
Year Ended
December 31,
2011 2010
(in thousands,
except percentages)
Provision for income taxes
$
23,676
$
36,228
Effective income tax rate
31.4
%
40.3
%
Year Ended
December 31, Change
2011 2010 $ %
(in thousands, except percentages
and average order value)
Products
$
471,885
$
434,035
$
37,850
9
%
Services
115,342
119,641
(4,299
)
(4
)%
Advertising
22
900
(878
)
(98
)%
Total FTD Revenues
$
587,249
$
554,576
$
32,673
6
%
Consumer orders
6,628
6,361
267
4
%
Average order value
$
62.15
$
59.72
$
2.43
4
%
Year Ended
December 31,
Change
2011 2010 $ %
(in thousands, except percentages)
FTD cost of revenues
$
367,232
$
343,988
$
23,244
7
%
FTD cost of revenues as a percentage of FTD revenues
62.5
%
62.0
%