Chrysler 2001 Annual Report Download - page 34
Download and view the complete annual report
Please find page 34 of the 2001 Chrysler annual report below. You can navigate through the pages in the report by either clicking on the pages listed below, or by using the keyword search tool below to find specific information within the annual report.-
 1
1 -
2
-
3
-
4
-
5
-
6
-
7
-
8
-
9
-
10
-
11
-
12
-
13
-
14
-
15
-
16
-
17
-
18
-
19
-
20
-
21
-
22
-
23
-
 24
24 -
 25
25 -
 26
26 -
 27
27 -
 28
28 -
 29
29 -
 30
30 -
 31
31 -
 32
32 -
 33
33 -
 34
34 -
 35
35 -
 36
36 -
 37
37 -
 38
38 -
 39
39 -
 40
40 -
 41
41 -
 42
42 -
 43
43 -
 44
44 -
45
-
46
-
47
-
48
-
49
-
50
-
51
-
52
-
53
-
54
-
55
-
56
-
57
-
58
-
59
-
60
-
61
-
62
-
63
-
64
-
65
-
66
-
67
-
68
-
69
-
70
-
71
-
72
-
73
-
74
-
75
-
76
-
77
-
78
-
79
-
80
-
81
-
82
 |
 |

34
34
Balance Sheet
As required under Legislative Decree No. 127/91, a detailed
analysis of the Group’s balance sheet, which is presented in
accordance with the statutory format for consolidated financial
statements, is provided in the Notes to the Consolidated
Financial Statements.
In the table below, however, the Group’s consolidated balance
sheet has been reclassified and presented in a condensed
format, showing its main components according to their
destination and breaking them down between Industrial
and Insurance Activities.
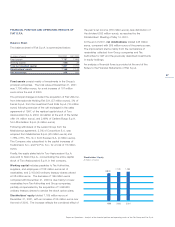
Working Capital
During 2001, the Group’s consolidated working capital
steadily decreased to negative 1,392 million euros at the
end of the year, far below the positive balance of 1,630 million
euros recorded at December 31, 2000.
An analysis of the changes affecting the main components
of working capital is provided below:
❚Inventories (raw materials, finished products, and work
in progress), net of advances received for contract work
in progress, amounted to 10,750 million euros, compared
with 10,036 million euros in 2000. This increase is due
mainly to work progress on the High-Speed Railway project
(+629 million euros), which was set off by an increase
in advances received, included under “other payables.”
On a comparable basis, and thus without considering the
aforesaid effect and changes in the scope of consolidation
(-79 million euros), the turnover index was in line with that
of the previous year (63 days).
❚Trade receivables totaled 6,466 million euros at the end
of 2001, down from the 6,744 million euros reported at the end
of 2000, as a result of current operations, including greater
recourse to discounting of receivables (+247 million euros).
Change in the scope of consolidation generated an increase of
305 million euros. On a comparable consolidation basis, credit
exposure improved to 38 days from the 2000 level of 42 days.
❚Trade payables increased from 11,805 million euros at the
end of 2000 to 13,520 million euros at December 31, 2001.
The increase stemmed from the different scope of
consolidation (for 110 million euros) and from increased
trade flows with the new joint ventures (for 668 million
euros). Net of these factors, debt exposure rose from 74
days in 2000 to 79 days due to a different mix in supplier
payment terms.
❚The balance of other receivables/payables amounted
to -5,088 million euros at December 31, 2001, compared
with -3,345 million euros at the end of 2000. The increase
was mainly due to the different scope of consolidation
(+505 million euros) and the previously mentioned advances
received for the High-Speed Railway project (+629 million
euros).
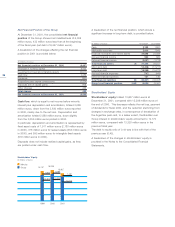
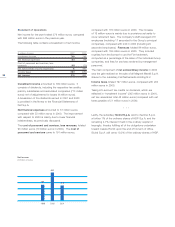
Net Property, Plant, and Equipment
Net property, plant, and equipment at December 31, 2001
totaled 13,887 million euros, 2,790 million euros less than at
the end of 2000 due to changes in the scope of consolidation
(-1,877 million euros), principally on account of the contribution
of Powertrain activities and sale of Fenice, and divestments
carried out as part of the company restructuring program,
among other reasons.
12/31/2001 12/31/2000
Industrial (*) Insurance Industrial (*) Insurance
(in millions of euros) Activities Activities Consolidated Activities Activities Consolidated
Net inventories 10,750 – 10,750 10,036 – 10,036
Trade receivables 5,763 703 6,466 6,165 579 6,744
Trade payables (13,273)(247)(13,520) (11,603) (202) (11,805)
Other receivables (payables), net (5,033)(55)(5,088) (3,315) (30) (3,345)
Working capital (1,793)401 (1,392) 1,283 347 1,630
Net property, plant, and equipment 13,139 748 13,887 15,895 782 16,677
Other fixed assets 13,006 15,319 28,523 11,177 12,122 23,253
Net deferred tax assets 1,642 (47)1,595 1,092 (85) 1,007
Reserves and allowances (7,096)(15,875)(22,971) (8,178) (12,713) (20,891)
Net invested capital 18,898 546 19,642 21,269 453 21,676
Net financial position (**) (7,858)1,823 (6,035) (8,228) 1,761 (6,467)
Stockholders’ equity 11,040 2,369 13,607 13,041 2,214 15,209
Fiat’s interest in stockholders’ equity 9,726 2,246 12,170 11,261 2,105 13,320
(*) This includes the Toro Assicurazioni Group and Neptunia Assicurazioni Marittime S.A.
(**) The values shown between parentheses indicate “indebtedness.”