Chesapeake Energy 2006 Annual Report Download - page 4
Download and view the complete annual report
Please find page 4 of the 2006 Chesapeake Energy annual report below. You can navigate through the pages in the report by either clicking on the pages listed below, or by using the keyword search tool below to find specific information within the annual report.-
 1
1 -
 2
2 -
 3
3 -
 4
4 -
 5
5 -
 6
6 -
 7
7 -
 8
8 -
 9
9 -
 10
10 -
 11
11 -
 12
12 -
 13
13 -
 14
14 -
 15
15 -
16
-
17
-
18
-
19
-
20
-
21
-
22
-
23
-
24
-
25
-
26
-
27
-
28
-
29
-
30
-
31
-
32
-
33
-
34
-
35
-
36
-
37
-
38
-
39
-
40
 |
 |

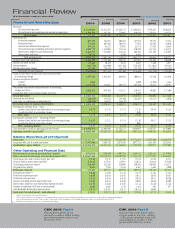
Financial Review
($ In thousands, except per share data) Years Ended December 31
Financial and Operating Data
2006 2005 2004 2003 2002 2001
$ 5,618,894 $ 3,272,585 $ 1,936,176 $ 1,296,822 $ 568,187 $ 820,318
1,706,701 1,392,705 773,092 420,610 170,315 148,733
$7,325,595 $ 4,665,290 $ 2,709,268 $ 1,717,432 $ 738,502 $ 969,051
489,499 316,956 204,821 137,583 98,191 75,374
176,440 207,898 103,931 77,893 30,101 33,010
139,152 64,272 37,045 23,753 17,618 14,449
1,589,770 1,358,003 755,314 410,288 165,736 144,373
1,462,759 945,001 611,322 386,258 235,198 181,565
54,753 – 4,500 6,402 – –
3,912,373 2,892,130 1,716,933 1,042,177 546,844 448,771
3,413,222 1,773,160 992,335 675,255 191,658 520,280
25,463 10,452 4,476 2,827 7,340 2,877
(300,722) (219,800) (167,328) (154,356) (112,031) (98,321)
117,396 (70,419) (24,557) (22,774) (19,827) (63,138)
(157,863) (279,767) (187,409) (174,303) (124,518) (158,582)
3,255,359 1,493,393 804,926 500,952 67,140 361,698
5,000 – – 5,000 (1,822) 3,565
1,247,036 545,091 289,771 185,360 28,676 140,727
2,003,323 948,302 515,155 310,592 40,286 217,406
–– – 2,389 – –
$ 2,003,323 $ 948,302 $ 515,155 $ 312,981 $ 40,286 $ 217,406
(88,645) (41,813) (39,506) (22,469) (10,117) (2,050)
(10,556) (26,874) (36,678) – – –
$ 1,904,122 $ 879,615 $ 438,971 $ 290,512 $ 30,169 $ 215,356
$ 4.78 $ 2.73 $ 1.73 $ 1.36 $ 0.18 $ 1.33
–– – 0.02 – –
$ 4.78 $ 2.73 $ 1.73 $ 1.38 $ 0.18 $ 1.33
$ 4.35 $ 2.51 $ 1.53 $ 1.20 $ 0.17 $ 1.25
–– – 0.01 – –
$ 4.35 $ 2.51 $ 1.53 $ 1.21 $ 0.17 $ 1.25
$ 4,843,474 $ 2,406,888 $ 1,432,274 $ 938,907 $ 428,797 $ 478,098
$ 4,045,109 $ 2,425,727 $ 1,402,522 $ 897,234 $ 408,783 $ 442,924
$ 24,417,167 $ 16,118,462 $ 8,244,509 $ 4,572,291 $ 2,875,608 $ 2,286,768
7,375,548 5,489,742 3,075,109 2,057,713 1,651,198 1,329,453
$ 11,251,471 $ 6,174,323 $ 3,162,883 $ 1,732,810 $ 907,875 $ 767,407
8,955,614 7,520,690 4,901,751 3,168,575 2,205,125 1,779,946
$ 13,647,141 $ 22,933,594 $ 10,504,390 $ 7,333,142 $ 3,717,645 $ 1,646,667
$ 5.41 $ 8.76 $ 5.65 $ 5.68 $ 4.28 $ 2.51
$ 56.25 $ 56.41 $ 39.91 $ 30.22 $ 30.18 $ 18.82
526,459 422,389 322,009 240,366 160,682 144,171
8,654 7,698 6,764 4,665 3,466 2,880
578,383 468,577 362,593 268,356 181,478 161,451
$ 8.86 $ 6.90 $ 5.23 $ 4.79 $ 3.61 $ 4.56
$ 0.85 $ 0.68 $ 0.56 $ 0.51 $ 0.54 $ 0.47
$ 0.31 $ 0.44 $ 0.29 $ 0.29 $ 0.17 $ 0.20
$ 0.24 $ 0.14 $ 0.10 $ 0.09 $ 0.10 $ 0.09
$ 2.53 $ 2.02 $ 1.69 $ 1.44 $ 1.30 $ 1.12
4,883 2,885 1,718 1,192 866 677
$ 0.23 $ 0.195 $ 0.17 $ 0.135 $ 0.06 –
$ 29.05 $ 31.73 $ 16.50 $ 13.58 $ 7.74 $ 6.61
Revenues
Oil and natural gas sales
Oil and natural gas marketing sales and service operations
Total revenues
Operating Costs
Production expenses
Production taxes
General and administrative expenses
Oil and natural gas marketing and service operation expenses
Depreciation, depletion and amortization
Impairments and other
Total operating costs
Income (loss) from operations
Interest and other income
Interest expense
Miscellaneous gains (losses)
Total other income (expense)
Income (loss) before income taxes and cumulative effect
of accounting change
Income tax expense (benefit):
Current
Deferred
Net income (loss) before cumulative effect of accounting
change, net of tax
Cumulative effect of accounting change, net of tax
Net income (loss)
Preferred stock dividends
Gain (loss) on redemption of preferred stock
Net income (loss) to common shareholders
Earnings per common share – basic:
Income (loss) before cumulative effect of accounting change
Cumulative effect of accounting change
EPS – basic
Earnings per common share – assuming dilution:
Income (loss) before cumulative effect of accounting change
Cumulative effect of accounting change
EPS – assuming dilution
Cash provided by (used in) operating activities (GAAP)
Operating cash flow (non-GAAP)*
Balance Sheet Data (at end of period):
Total assets
Long-term debt, net of current maturities
Stockholders’ equity (deficit)
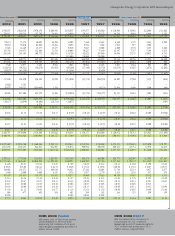
Other Operating and Financial Data
Proved reserves in natural gas equivalents (mmcfe)
Future net oil and natural gas revenues discounted at 10%**
Natural gas price used in reserve report (per mcf)
Oil price used in reserve report (per bbl)
Natural gas production (mmcf)
Oil production (mbbls)
Production (mmcfe)
Sales price per mcfe***
Production expense per mcfe
Production taxes per mcfe
General and administrative expense per mcfe
Depreciation, depletion and amortization expense per mcfe
Number of employees (full-time at end of period)
Cash dividends declared per common share
Stock price (at end of period – split adjusted)
* See page 15 for definition of this non-GAAP measure.
** PV-10 is the present value (10% discount rate) of estimated future gross revenue to be generated from the production of proved reserves, net of production and future development
costs, using assumed prices and costs. Please see page 8 of our Form 10-K for information on the standardized measure of future net cash flow pursuant to SFAS 69.
*** Excludes unrealized gains (losses) on oil and natural gas hedging.
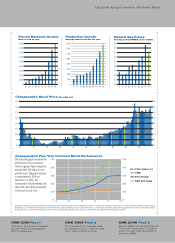
We replaced 348% of our
production with a drillbit finding
and development cost of only
$1.93 per mcfe
CHK 2006 Fact 4
We were the most active driller
of new wells in the U.S., drilling
1,488 gross operated wells and
participating in another 1,534
gross wells drilled by others
CHK 2006 Fact 5