Chesapeake Energy 2006 Annual Report Download - page 3
Download and view the complete annual report
Please find page 3 of the 2006 Chesapeake Energy annual report below. You can navigate through the pages in the report by either clicking on the pages listed below, or by using the keyword search tool below to find specific information within the annual report.-
 1
1 -
 2
2 -
 3
3 -
 4
4 -
 5
5 -
 6
6 -
 7
7 -
 8
8 -
 9
9 -
 10
10 -
 11
11 -
 12
12 -
 13
13 -
 14
14 -
15
-
16
-
17
-
18
-
19
-
20
-
21
-
22
-
23
-
24
-
25
-
26
-
27
-
28
-
29
-
30
-
31
-
32
-
33
-
34
-
35
-
36
-
37
-
38
-
39
-
40
 |
 |

The 2006 peer group was comprised of Anadarko Petroleum Corporation, Apache Corporation, Cabot Oil & Gas Corporation, XTO Energy, Inc., Devon Energy Corporation, EOG Resources, Inc., Forest Oil Corporation, Newfield Exploration Company,
Noble Energy, Inc., Occidental Petroleum Corporation, Pioneer Natural Resources Company, Pogo Producing Co., Quicksilver Resources, Inc., Range Resources Corporation, Southwestern Energy Company and St. Mary Land & Exploration Company.
Burlington Resources, Inc. and Kerr McGee Corporation are not included in the peer group in 2006 due to their acquisitions by ConocoPhillips and Anadarko Petroleum Corporation, respectively.
S&P 500 Index
Chesapeake Energy Corporation 2006 Annual Report
CHK 2006 Fact 1 CHK 2006 Fact 2
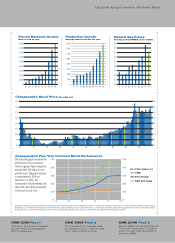
We increased our proved reserves
19% to 9.0 tcfe from 7.5 tcfe in
2005 through both acquisitions
and the drillbit
CHK 2006 Fact 3
Chesapeake’s Five-Year Common Stock Performance
Chesapeake’s Stock Price At month end
06
05
0403
02
0100999897
01 02 03 04 06
$400
$300
$200
$100
$0
$500
05
CHK
As of December 31
0605040302010099989706050403020100999897 06050403020100999897
Peer Group
$400
$300
$200
$100
$0
$500
Our stock price has increased
2,100% since Chesapeake’s
IPO 14 years ago
We increased our average daily
production 23% to 1,585 mmcfe
from 1,284 mmcfe in 2005
1
1
The adjacent graph compares the
performance of our common
stock to a group of peer companies
and the S&P 500 Index for the
past five years. The graph assumes
an investment of $100 on
December 31, 2001, the
reinvestment of all dividends and
shows the value of the investment
at the end of each year.
Natural Gas Prices
Average yearly NYMEX, $ per mmbtu
Production Growth
Average mmcfe per day for year
Proved Reserves Growth
Bcfe at end of year