Chesapeake Energy 2004 Annual Report Download - page 8
Download and view the complete annual report
Please find page 8 of the 2004 Chesapeake Energy annual report below. You can navigate through the pages in the report by either clicking on the pages listed below, or by using the keyword search tool below to find specific information within the annual report.-
 1
1 -
 2
2 -
 3
3 -
 4
4 -
 5
5 -
 6
6 -
 7
7 -
 8
8 -
 9
9 -
 10
10 -
 11
11 -
 12
12 -
 13
13 -
 14
14 -
 15
15 -
 16
16 -
 17
17 -
 18
18 -
 19
19 -
20
-
21
 |
 |

4
At Chesapeake, we are discovering the company’s rapidly increasing
scale is actually enhancing our operational and financial returns
rather than inhibiting them. While somewhat counter-intuitive, we
have achieved these enhanced returns by remaining focused on the
following six key drivers of the company’s strategy.
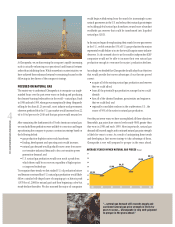
FOCUSED ON NATURAL GAS
The easiest way to understand Chesapeake is to recognize our single-
minded focus over the past seven years on finding and producing
the cleanest-burning hydrocarbon in the world – natural gas. Back
in 1998 and early 1999, when gas was exceptionally cheap (frequently
selling for less than $1.25 per mcf), most industry and government
observers predicted that the U.S. gas market would increase from 22
tcf to 30 tcf per year by 2010 and that gas prices would remain low.
After examining the fundamentals of North American natural gas,
we concluded these predictions were unlikely to come true and began
repositioning the company to pursue a contrarian strategy based on
the following beliefs:
• gas production depletion rates would accelerate;
• finding, development and operating costs would increase;
• natural gas demand would gradually move away from more
cost-sensitive industrial demand to less cost-sensitive power
generation demand; and
• U.S. natural gas production would soon reach a peak from
which there could be no recovery, regardless of higher prices
or improved technology.
To recognize these trends, we first studied U.S. oil production history
and became convinced that U.S. natural gas production would likely
follow a similar bell-shaped curve of ramping up to a historic peak
(1970 for oil, 2000 for natural gas) and then beginning a slow but
steady decline thereafter. We also reasoned the major oil companies
would begin withdrawing from the search for increasingly scarce
natural gas reserves in the U.S. and refocus their natural gas strategies
on building global natural gas franchises around more abundant
worldwide gas reserves that could be transformed into liquefied
natural gas (LNG).
As the majors began de-emphasizing their search for new gas reserves
in the U.S., we felt certain the 35% of U.S. gas production the majors
represented would decline at a rate that would surprise many industry
observers. It also seemed clear to us the smaller independent E&P
companies would not be able to increase their own natural gas
production enough to overcome the majors’ production declines.
Accordingly, we decided that Chesapeake should adopt four objectives
that would provide first-mover advantages if our theories proved
correct:
• acquire all of the existing natural gas production and reserves
that we could afford;
• lease all the potentially gas productive acreage that we could
identify;
• hire all of the talented landmen, geoscientists and engineers
that we could find; and
• regionally consolidate onshore in the southwestern U.S., the
source of 50% of the nation’s natural gas production.
Over the past seven years, we have accomplished all these objectives.
Meanwhile, gas prices have risen to levels nearly 500% greater than
they were in 1998 and early 1999. More importantly, natural gas
demand still exceeds supply and continued natural gas price strength
is likely for years to come. As a result of anticipating these trends
and developing a first-mover strategy to take advantage of them,
Chesapeake is very well-prepared to prosper in the years ahead.
CHESAPEAKE ENERGY CORPORATION ANNUAL REPORT 2004
“...natural gas demand still exceeds supply and
continued natural gas price strength is likely for
years to come... Chesapeake is very well-prepared
to prosper in the years ahead.
”
009998 01 02 03 04
$3.88
$2.27
$2.30
$4.26
$3.22
$5.38
$6.13
$7
$6
$5
$4
$3
$2
$1
$0
AVERAGE YEARLY NYMEX NATURAL GAS PRICES Per mcf