Chesapeake Energy 2004 Annual Report Download - page 3
Download and view the complete annual report
Please find page 3 of the 2004 Chesapeake Energy annual report below. You can navigate through the pages in the report by either clicking on the pages listed below, or by using the keyword search tool below to find specific information within the annual report.-
 1
1 -
 2
2 -
 3
3 -
 4
4 -
 5
5 -
 6
6 -
 7
7 -
 8
8 -
 9
9 -
 10
10 -
 11
11 -
 12
12 -
 13
13 -
 14
14 -
15
-
16
-
17
-
18
-
19
-
20
-
21
 |
 |

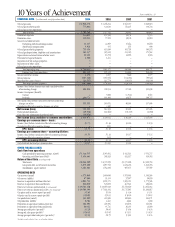
1 Excludes unrealized gains (losses) on oil and gas hedging.
FINANCIAL DATA ($ in thousands, except per share data)
Oil and gas sales
Oil and gas marketing sales
Oil and gas service operations
Total revenues
Production expenses
Production taxes
General and administrative:
Excluding stock-based compensation
Stock-based compensation
Oil and gas marketing expenses
Oil and gas depreciation, depletion and amortization
Depreciation and amortization of other assets
Provision for legal settlements
Impairment of oil and gas properties
Impairment of other assets
Oil and gas service operations
Total operating costs
Income (loss) from operations
Interest and other income
Interest expense
Miscellaneous gains (losses)
Total other income (expense)
Income (loss) before income taxes and cumulative effect
of accounting change
Income tax expense (benefit):
Current
Deferred
Net income (loss) before cumulative effect of accounting
change, net of tax
Cumulative effect of accounting change, net of tax
Net income (loss)
Preferred stock dividends
Gain (loss) on redemption of preferred stock
Net income (loss) available to common shareholders
Earnings per common share – basic:
Income (loss) before cumulative effect of accounting change
Cumulative effect of accounting change
EPS - basic
Earnings per common share – assuming dilution:
Income (loss) before cumulative effect of accounting change
Cumulative effect of accounting change
EPS - assuming dilution
Cash dividends declared per common share
OTHER FINANCIAL DATA
Cash flow from operations
Cash provided by operating activities (GAAP)
Operating cash flow (non-GAAP)
Balance Sheet Data (at end of period):
Total assets
Long-term debt, net of current maturities
Stockholders’ equity (deficit)
OPERATING DATA
Gas reserves (mmcf)
Oil reserves (mbbls)
Reserves in equivalent million cubic feet
Reserves in equivalent thousand barrels
Future net revenues undiscounted ($ in thousands)
Future net revenues discounted at 10% ($ in thousands)
Gas price used in reserve report (per mcf)
Oil price used in reserve report (per bbl)
Gas production (mmcf)
Oil production (mbbls)
Production in equivalent million cubic feet
Production in equivalent thousand barrels
Average gas sales price (per mcf) 1
Average oil sales price (per bbl) 1
Average gas equivalent sales price (per mcfe) 1
10 Years of Achievement Years ended Dec. 31