Chesapeake Energy 2004 Annual Report Download - page 7
Download and view the complete annual report
Please find page 7 of the 2004 Chesapeake Energy annual report below. You can navigate through the pages in the report by either clicking on the pages listed below, or by using the keyword search tool below to find specific information within the annual report.-
 1
1 -
 2
2 -
 3
3 -
 4
4 -
 5
5 -
 6
6 -
 7
7 -
 8
8 -
 9
9 -
 10
10 -
 11
11 -
 12
12 -
 13
13 -
 14
14 -
 15
15 -
 16
16 -
 17
17 -
 18
18 -
19
-
20
-
21
 |
 |

CHESAPEAKE ENERGY CORPORATION ANNUAL REPORT 2004
3
“…we expect to increase our production by at
least 20% in 2005, and in doing so, expect to
become the third largest independent producer
of U.S. natural gas.”
FOCUSED. We believe this word best describes Chesapeake.
Despite the rapid growth of our company during the past seven years
from a struggling small-cap, with a $1 billion enterprise value, to
a successful industry leader with an $11 billion enterprise value, we
have remained focused on creating shareholder value through the
successful execution of a clear and concise business strategy.
This strategy focuses on achieving the following results:
• BUILDING one of the nation’s largest natural gas resource
bases;
• GENERATING double-digit annual organic growth through
the drillbit;
• CREATING double-digit annual acquisition growth through
regional consolidation of assets;
• DISCOVERING deep conventional natural gas reserves and
shallower unconventional natural gas reserves;
• ATTRACTING and motivating many of the best employees in
the industry; and
• PROVIDING responsible stewardship of our environment and
active leadership in the communities where we operate.
2004 IN REVIEW
As evidence of the success of Chesapeake’s business strategy, we
would like to highlight the company’s operational and financial
achievements of 2004. In doing so, we also extend our appreciation
to the company’s 1,900 employees for helping deliver Chesapeake’s
terrific performance during the past
year. Highlights of 2004 include:
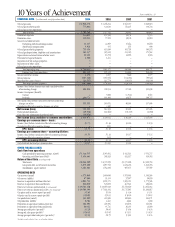
• Oil and natural gas
production increased 35%
from 268 bcfe to 363 bcfe;
• Proved oil and natural gas
reserves increased 55% from
3,169 bcfe to 4,902 bcfe;
• Revenues rose 58% from $1.72
billion to $2.71 billion;
• Ebitda* increased 52% from
$1.04 billion to $1.58 billion;
• Operating cash flow** grew
57% from $904 million to
$1.42 billion;
• Net income to common
shareholders increased 51%
from $291 million to $439
million;
• Reserve replacement for the
year reached 578% at a
drilling and acquisition cost
of only $1.21 per mcfe; and
• Total return to common
shareholders reached 23%,
improving our total return to
common shareholders to
almost 1,600% for the 12 years
since our IPO in 1993.
As a result of the company’s 2004 achievements, Chesapeake has
become the fourth largest independent producer of U.S. natural gas,
producing 2% of the nation’s natural gas from our interests in
20,000 wells. In 2005, we again expect to lead the industry in drilling
activity, utilizing about 6% of the nation’s active drilling rig fleet
to drill more than 1,000 new wells. Moreover, we expect
to increase our production by at least 20% in 2005 and, in doing
so, expect to become the third largest independent producer of U.S.
natural gas.
This industry-leading drilling campaign requires the great people
and great geological prospects that Chesapeake has in abundance.
We are constantly energized by the role Chesapeake plays in meeting
our country’s increasing need for clean-burning, domestically-
produced natural gas. We firmly believe the building blocks of future
success are in place and should help make 2005 another very
rewarding year for Chesapeake’s shareholders.
BENEFITS OF A FOCUSED STRATEGY
Achieving and maintaining focus in any business is difficult,
especially when the business has grown as rapidly as ours. Greater
size often brings reduced focus as many exploration and production
(E&P) companies discover their existing strategies require ongoing
modification to accommodate increasing scale. This seemingly
natural response too often results in operational mediocrity rather
than in the operational excellence that we strive to achieve.
1,355
+31%
+24%
+44%
1,780
2,205
3,169
+55%
4,902
00 01 02 03 04
PROVED RESERVES
GROWTH In bcfe
134.2
+20%
+12%
+48%
161.5
181.5
268.4
+35%
362.6
00 01 02 03 04
PRODUCTION
GROWTH In bcfe
*Ebitda is a non-GAAP measure that represents net income before the cumulative effect of accounting changes, income tax expense, interest
expense and depreciation, depletion and amortization expense.
** Operating cash flow is a non-GAAP measure that represents net cash provided by operating activities before changes in assets and liabilities.