Chesapeake Energy 2001 Annual Report Download - page 5
Download and view the complete annual report
Please find page 5 of the 2001 Chesapeake Energy annual report below. You can navigate through the pages in the report by either clicking on the pages listed below, or by using the keyword search tool below to find specific information within the annual report.-
 1
1 -
 2
2 -
 3
3 -
 4
4 -
 5
5 -
 6
6 -
 7
7 -
 8
8 -
 9
9 -
 10
10 -
 11
11
 |
 |

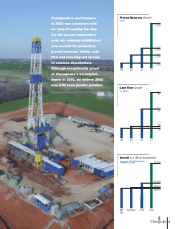
Chesapeake's performance
in 2001 was consistent with
our goal of
Leading the Way.
For the second consecutive
year, our company established
new records for production,
proved reserves, ebitda, cash
flow and recurring net income
to common shareholders.
Although exceptionally proud
of Chesapeake's accomplish-
ments in 2001, we believe 2002
may hold even greater promise.
1,091
1,206
1,355
1,780
98 99 00 01
Proved Reserves Growth
+11%
+71%
+20%
+12%
+31%
In bcfe
115
138
305
522
Cash Flow Growth
$ in millions
3
+121%
Growth in a $100 Investment
February 4, 1993 (CHK IPO Date)
thru March 31, 2002
$304.50
$255.29
$262.29
S&P
500 NASDAQ DJIA CHK
98 99 00 01
$574.52