Chesapeake Energy 2001 Annual Report Download - page 2
Download and view the complete annual report
Please find page 2 of the 2001 Chesapeake Energy annual report below. You can navigate through the pages in the report by either clicking on the pages listed below, or by using the keyword search tool below to find specific information within the annual report.-
 1
1 -
 2
2 -
 3
3 -
 4
4 -
 5
5 -
 6
6 -
 7
7 -
 8
8 -
 9
9 -
 10
10 -
 11
11
 |
 |

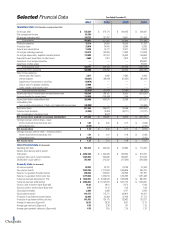
Operations Data
(
$ in thousands, except per share data
)
Oil and gas sales $ 735,529 $ 470,170 $ 280,445 $ 256,887
Risk management income 84,789 — — —
Oil and gas marketing sales 148,733 157,782 74,501 121,059
Total revenues 969,051 627,952 354,946 377,946
Production expenses 75,374 50,085 46,298 51,202
Production taxes 33,010 24,840 13,264 8,295
General and administrative 14,449 13,177 13,477 19,918
Oil and gas marketing expenses 144,373 152,309 71,533 119,008
Oil and gas depreciation, depletion and amortization 172,902 101,291 95,044 146,644
Depreciation and amortization of other assets 8,663 7,481 7,810 8,076
Impairment of oil and gas properties —— — 826,000
Impairment of other assets —— — 55,000
Total operating costs 448,771 349,183 247,426 1,234,143
Income (loss) from operations 520,280 278,769 107,520 (856,197)
Other income (expense):
Interest and other income 2,877 3,649 8,562 3,926
Interest expense (98,321) (86,256) (81,052) (68,249)
Impairment of investments in securities (10,079) —— —
Gain on sale of Canadian subsidiary 27,000 — — —
Gothic standby credit facility costs (3,392) —— —
Total other income (expense) (81,915) (82,607) (72,490) (64,323)
Income (loss) before income taxes and extraordinary item 438,365 196,162 35,030 (920,520)
Provision (benefit) for income taxes 174,959 (259,408) 1,764 —
Income (loss) before extraordinary item 263,406 455,570 33,266 (920,520)
Extraordinary item:
Loss on early extinguishment of debt, net of applicable income taxes (46,000) — — (13,334)
Net income (loss) 217,406 455,570 33,266 (933,854)
Preferred stock dividends (2,050) (8,484) (16,711) (12,077)
Gain on redemption of preferred stock —6,574 — —
Net income (loss) available to common shareholders $ 215,356 $ 453,660 $ 16,555 $ (945,931)
Earnings (loss) per common share – basic:
Income (loss) before extraordinary item $ 1.61 $ 3.52 $ 0.17 $ (9.83)
Extraordinary item (0.28) — — (0.14)
Net income (loss) $ 1.33 $ 3.52 $ 0.17 $ (9.97)
Earnings (loss) per common share – assuming dilution:
Income (loss) before extraordinary item $ 1.51 $ 3.01 $ 0.16 $ (9.83)
Extraordinary item (0.26) — — (0.14)
Net income (loss) $ 1.25 $ 3.01 $ 0.16 $ (9.97)
Other Financial Data
($ in thousands)
Operating cash flow $ 521,612 $ 304,934 $ 137,884 $ 115,200
Balance sheet data (at end of period):
Total assets $ 2,286,768 $ 1,440,426 $ 850,533 $ 812,615
Long-term debt, net of current maturities 1,329,453 944,845 964,097 919,076
Stockholders’ equity (deficit) 767,407 313,232 (217,544) (248,568)
Property Data
($ in thousands)
Oil reserves (mbbls) 30,093 23,797 24,795 22,593
Gas reserves (mmcf) 1,599,386 1,212,033 1,056,826 955,791
Reserves in equivalent thousand barrels 296,658 225,802 200,933 181,891
Reserves in equivalent million cubic feet 1,779,946 1,354,813 1,205,595 1,091,348
Future net revenues discounted at 10% $ 1,646,667 $ 6,046,028 $ 1,089,496 $ 660,991
Future net revenues undiscounted $ 2,966,032 $ 10,702,974 $ 1,891,175 $ 1,208,641
Oil price used in reserve report ($ per bbl) 18.82 26.41 24.72 10.48
Gas price used in reserve report ($ per mcf) 2.51 10.12 2.25 1.68
Oil production (mbbls) 2,880 3,068 4,147 5,976
Gas production (mmcf) 144,171 115,771 108,610 94,421
Production in equivalent thousand barrels 26,909 22,363 22,249 21,713
Production in equivalent million cubic feet 161,451 134,179 133,492 130,277
Average oil sales price ($ per bbl) 26.92 26.39 16.01 12.70
Average gas sales price ($ per mcf) 4.56 3.36 1.97 1.92
Average gas equivalent sales price ($ per mcfe) 4.56 3.50 2.10 1.97
Year Ended December 31,
2001 2000 1999 1998
Selected Financial Data