Chesapeake Energy 2000 Annual Report Download - page 3
Download and view the complete annual report
Please find page 3 of the 2000 Chesapeake Energy annual report below. You can navigate through the pages in the report by either clicking on the pages listed below, or by using the keyword search tool below to find specific information within the annual report.-
 1
1 -
 2
2 -
 3
3 -
 4
4 -
 5
5 -
 6
6 -
 7
7 -
 8
8 -
 9
9 -
 10
10 -
 11
11 -
 12
12 -
 13
13 -
 14
14 -
15
-
16
-
17
-
18
-
19
-
20
-
21
-
22
-
23
-
24
-
25
-
26
-
27
-
28
-
29
-
30
-
31
-
32
-
33
-
34
-
35
-
36
-
37
-
38
-
39
-
40
-
41
-
42
-
43
-
44
-
45
-
46
-
47
-
48
-
49
-
50
-
51
-
52
-
53
-
54
-
55
-
56
-
57
-
58
-
59
-
60
-
61
-
62
-
63
-
64
-
65
-
66
-
67
-
68
-
69
-
70
-
71
-
72
-
73
-
74
-
75
-
76
-
77
-
78
-
79
-
80
-
81
-
82
-
83
-
84
-
85
-
86
-
87
-
88
-
89
-
90
-
91
-
92
-
93
-
94
-
95
-
96
-
97
-
98
-
99
-
100
-
101
-
102
-
103
-
104
-
105
-
106
-
107
-
108
-
109
-
110
-
111
-
112
-
113
-
114
-
115
-
116
-
117
-
118
-
119
-
120
-
121
-
122
 |
 |

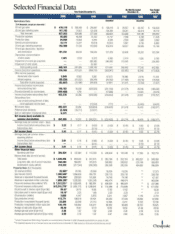
Selected Financial Data
Year Ended December 31,
Includes Chesapeake and Gothic Energy Corporation on a combined basis at December31, 2000. Chesapeake acquired Gothic on January 16, 2001
**An independent appraisal of our oil and gas reserves was sot pen armed as sf December31, 1996, because our fiscal year-end at that time was June 30. Cheseake
1999 1998 1997 1997 1996 1997
Operations Data
(sin thousands, except per share data)
Unaudited Unaudited
Oil and gas sales $470,170 $280,445 $256887 $198,410 $95,657 $90167 $192.920
Oil and gas marketing sales 157,782 74,501 121,059 104,394 58,241 30,019 76,172
Total revenues 627,952 354,946 377,946 302,804 153,898 120,186 269,092
Production expenses 50,085 46,298 51,202 14,737 7,560 4,268 11,445
Production taxes 24,840 13,264 8,295 4,590 2,534 1,606 3,662
General and administrative 13,177 13,477 19,918 10,910 5,847 3,739 8,802
Oil and gas marketing expenses 152,309 71,533 119,008 103,819 58,227 29,548 75,140
Oil and gas depreciation, depletion
and amortization 101,291 95,044 146,644 127,429 60,408 36,243 103,264
Depreciation and amortization
ot other assets 7,481 7,810 8,076 4,360 2,414 1,836 3,782
Impairment ot oil and gas properties -826,000 346,000 110,000 236,000
Impairment ot other assets 55,000 -
Total operating costs 349,183 247,426 1,234,143 611,845 246,990 77,240 442,095
Income (loss) trom operations 278,769 107,520 (856,197) (309,041) (93,092) 42,946 (173,003)
Other income (expense):
Interest and other income 3,649 8,562 3,926 87,673 78,966 2,516 11,223
Interest expense (86,256) (81,052) (68,249) (29,782) (17,448) (6,216) (18,550)
Total other income (expense) (82,607) (72,490) (64,323) 57,891 61,518 (3,700) (7,327)
Income (loss) before income taxes
and extraordinary item 196,162 35,030 (920,520) (251,150) (31,574) 39,246 (180,330)
Provision (benefit) for income taxes (259,408) 1,764 (17,898) 14,325 (3,573)
Income (loss) betore extraordinary item 455,570 33,266 (920,520) (233,252) (31,574) 24,921 (176,757)
Extraordinary item:
Loss on early extinguishment ot debt,
net ot applicable income taxes -(13,334) (177) (6,443) (6,620)
Net income (loss) 455,570 33,266 (933,854) (233,429) (31,574) 18,478 (183,377)
Preterred stock dividends (8,484) (16,711) (12,077)
Gain on redemption ot preterred stock 6,574
Net income (loss) available to
common shareholders $453,660 $16,555 $(945,931) $(233,429) $(31,574) $18,478 $(183,377)
Earnings (loss) per common share basic.
Income (loss) before extraordinary item $3.52 $0.17 $(9.83) $(3.30) $(0.45) $0.40 $(2.69)
Extraordinary item -(0.14) (0.10) (0.10)
Net income (loss) $3.52 $0.17 $(9.97) $(3.30) $(0.45) $0.30 $(2.79)
Earnings (loss) per common share
assuming dilution:
Income (loss) betore extraordinary item $3.01 $0.16 $(9.83) $(3.30) $(0.45) $0.38 $(2.69)
Extraordinary item (0.14) (0.10) (0.10)
Net income (loss) $3.01 $0,16 $(9.97) $(3.30) $(0.45) $0.28 $(2.79)
Other financial data:
Operating cash tIcw $304,934 $137,884 $115,200 $226,639 $141,248 $77,325 $162,716
Balance sheet data (at end cI period):
Total assets $ 1,440,426 $850,533 $812,615 $952,784 $952,784 $860,597 $949,068
Long-term debt, net of current maturities 944,845 964,097 91 9.076 508,992 508,992 220,149 508,950
Stockholders' equity (deficit) 313,232 (217,544) (248,568) 280,206 280.206 484,062 286,889
Property Data ($ in thousands)
Oil reserves (mbbls) 25,565* 24,795 22,593 18,226 18,226 ** 17,373
Gas reserves (mmct) 1,502,940* 1,056,826 955,791 339,118 339,118 298,766
Reserves in equivalent thousand barrels 276,055* 200,933 181,891 74,746 74,746 ** 67,167
Reserves in equivalent million cubic teet 1,656,328* 1,205,595 1,091,348 448,474 448,474 ** 403.004
Future net revenues discounted at 10% $ 7,312,531* $1,089,496 $660,991 $466,509 $466,509 ** $437,386
Future net revenues undiscounted $13,315,779* $1,891,175 $1,208,641 $715,098 $715,098 ** $611,954
Oil price used in reserve report ($ per bbl( 26.42* 24.72 10.48 17.62 17.62 18.38
Gas prices used in reserve report ($ per mct( 10.13* 2.25 1.68 2.29 2.29 ** 2.12
Oil production (mbbls) 3,068 4,147 5,976 3.511 1,857 1.116 2,770
Gas production (mmct) 115,771 108,610 94,421 59,236 27,326 30,095 62,005
Production in equivalent thousand barrels 22,363 22,249 21,713 13,384 6,411 6,132 13,104
Production in equivalent million cubic feet 134,179 133,492 130,277 80,302 38,468 36,791 78,625
Average oil sale price ($ per bbl( 26.39 16.01 12.70 19.39 18.59 21.88 20.93
Average gas sale price ($ per mct) 3.36 1.97 1.92 2.20 2.24 2.18 2.18
Average gas equivalent sale price ($ per mcte) 3.50 2.10 1.97 2.47 2.49 2.45 2.45
Six Months Ended Year Ended
December 31, June 30,