Charles Schwab 2010 Annual Report Download - page 10
Download and view the complete annual report
Please find page 10 of the 2010 Charles Schwab annual report below. You can navigate through the pages in the report by either clicking on the pages listed below, or by using the keyword search tool below to find specific information within the annual report.-
 1
1 -
 2
2 -
 3
3 -
 4
4 -
 5
5 -
 6
6 -
 7
7 -
 8
8 -
 9
9 -
 10
10 -
 11
11 -
 12
12 -
 13
13 -
 14
14 -
 15
15 -
 16
16 -
 17
17 -
 18
18 -
 19
19 -
 20
20 -
 21
21 -
22
-
23
-
24
-
25
-
26
-
27
-
28
-
29
-
30
-
31
-
32
-
33
-
34
-
35
-
36
-
37
-
38
-
39
-
40
-
41
-
42
-
43
-
44
-
45
-
46
-
47
-
48
-
49
-
50
-
51
-
52
-
53
-
54
-
55
-
56
-
57
-
58
-
59
-
60
-
61
-
62
-
63
-
64
-
65
-
66
-
67
-
68
-
69
-
70
-
71
-
72
-
73
-
74
-
75
-
76
-
77
-
78
-
79
-
80
-
81
-
82
-
83
-
84
-
85
-
86
-
87
-
88
-
89
-
90
-
91
-
92
-
93
-
94
-
95
-
96
-
97
-
98
-
99
-
100
-
101
-
102
-
103
-
104
-
105
-
106
-
107
-
108
-
109
-
110
-
111
-
112
-
113
-
114
-
115
-
116
-
117
-
118
-
119
-
120
-
121
-
122
-
123
-
124
-
125
-
126
-
127
-
128
-
129
-
130
-
131
-
132
-
133
-
134
-
135
 |
 |

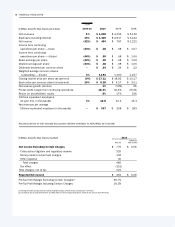
Net Income Excluding Certain Charges $ 775 $ 0.65
Class action litigation and regulatory reserve 320
Money market mutual fund charges 132
Other expense 30
Total charges 482
Tax effect (161)
Total charges, net of tax 321
Reported Net Income $ 454 $ 0.38
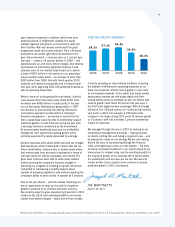
Pre-Tax Prot Margin Excluding Certain Charges(2) 29.7%
Pre-Tax Prot Margin Including Certain Charges 18.3%
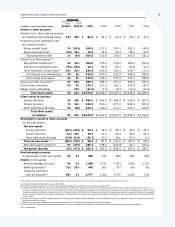
(In Millions, Except Per Share Amounts and as Noted) 2009-10 2010 2009 2008
GROWTH RATE
1-YEAR
Net revenues 1% $ 4,248 $ 4,193 $ 5,150
Expenses excluding interest 19% $ 3,469 $ 2,917 $ 3,122
Net income (42%) $ 454 $ 787 $ 1,212
Income from continuing
operations per share — basic (44%) $ .38 $ .68 $ 1.07
Income from continuing
operations per share — diluted (44%) $ .38 $ .68 $ 1.06
Basic earnings per share (44%) $ .38 $ .68 $ 1.06
Diluted earnings per share (44%) $ .38 $ .68 $ 1.05
Dividends declared per common share – $ .24 $ .24 $ .22
Weighted-average common shares
outstanding — diluted 3% 1,194 1,160 1,157
Closing market price per share (at year-end) (9%) $ 17.11 $ 18.82 $ 16.17
Book value per common share (at year-end) 19% $ 5.18 $ 4.37 $ 3.51
Net revenue growth (decline) 1% (19%) 3%
Pre-tax prot margin from continuing operations 18.3% 30.4% 39.4%
Return on stockholders’ equity 8% 17% 31%
Full-time equivalent employees
(at year end, in thousands) 3% 12.8 12.4 13.4
Net revenues per average
full-time equivalent employee (in thousands) – $ 337 $ 338 $ 383
8 FINANCIAL HIGHLIGHTS
(In Millions, Except Per Share Amounts, Unaudited) 2010
AMOUNT
EARNINGS
PER SHARE(1)
RECONCILIATION OF NET INCOME EXCLUDING CERTAIN CHARGES TO REPORTED NET INCOME
(1) Earnings per share calculated based on diluted weighted-average common shares outstanding of 1,194 million.
(2) Calculated as pre-tax prot of $779 million plus $482 million of certain charges listed above, divided by net revenues of $4,248 million.