CenterPoint Energy 2009 Annual Report Download - page 7
Download and view the complete annual report
Please find page 7 of the 2009 CenterPoint Energy annual report below. You can navigate through the pages in the report by either clicking on the pages listed below, or by using the keyword search tool below to find specific information within the annual report.-
 1
1 -
 2
2 -
 3
3 -
 4
4 -
 5
5 -
 6
6 -
 7
7 -
 8
8 -
 9
9 -
 10
10 -
 11
11 -
 12
12 -
 13
13 -
 14
14 -
 15
15 -
 16
16 -
 17
17 -
 18
18 -
19
-
20
-
21
-
22
-
23
-
24
-
25
-
26
-
27
-
28
-
29
-
30
-
31
-
32
-
33
-
34
-
35
-
36
-
37
-
38
-
39
-
40
-
41
-
42
-
43
-
44
-
45
-
46
-
47
-
48
-
49
-
50
-
51
-
52
-
53
-
54
-
55
-
56
-
57
-
58
-
59
-
60
-
61
-
62
-
63
-
64
-
65
-
66
-
67
-
68
-
69
-
70
-
71
-
72
-
73
-
74
-
75
-
76
-
77
-
78
-
79
-
80
-
81
-
82
-
83
-
84
-
85
-
86
-
87
-
88
-
89
-
90
-
91
-
92
-
93
-
94
-
95
-
96
-
97
-
98
-
99
-
100
-
101
-
102
-
103
-
104
-
105
-
106
-
107
-
108
-
109
-
110
-
111
-
112
-
113
-
114
-
115
-
116
-
117
-
118
-
119
-
120
-
121
-
122
-
123
-
124
-
125
-
126
-
127
-
128
-
129
-
130
-
131
-
132
-
133
-
134
-
135
-
136
-
137
-
138
-
139
-
140
-
141
-
142
-
143
-
144
-
145
-
146
-
147
-
148
-
149
-
150
 |
 |

5
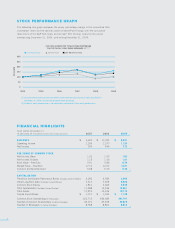
service in 2007, to bring significant
new gas supplies to market from
the emerging shale plays.
Significantly lower natural gas
and natural gas liquids prices had
a negative impact on our field
services business. Operating income
declined from $147 million in
2008 to $94 million in 2009, with
nearly all of the decline attributable
to reduced energy prices. However,
throughput increased over 2008,
and we are optimistic about the
future of this business. During 2009,
we invested nearly $350 million
in new gathering and treating
facilities primarily associated with
the Haynesville, Fayetteville and
Woodford shale plays. is was
the largest capital program in this
business’ history. We are fortunate
to count among our customers some
of the strongest, most creditworthy
participants developing these prolific
gas reserves.
Our competitive natural gas sales
and services business results were
below our expectations in 2009.
Operating income was $21 million
compared to $62 million in 2008.
We had success in growing our retail
base of commercial and industrial
customers to more than 11,000, but
our wholesale business suffered from
reduced locational price differentials
and lower seasonal storage spreads.
Our goal is to continue to strengthen
our retail base and to capture
wholesale market opportunities
as they arise.
ADVANCING ENERGY SOLUTIONS
As we enter into a new decade,
there is a renewed focus on our
nation’s energy policies, driven by
concerns about carbon emissions,
energy efficiency and energy
security. ere is no single solution
that will address all these issues.
We will have to embrace a number
of solutions if we are going to be
successful in meeting the country’s
energy demands while protecting
the environment and promoting our
national interests. As a company,
we are involved in advancing a
number of these solutions.
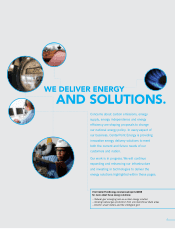
We will have to embrace a number of solutions
if we are going to be successful in meeting the
country’s energy demands while protecting the
environment and promoting our national interests.
As a company, we are involved in advancing a
number of these solutions.
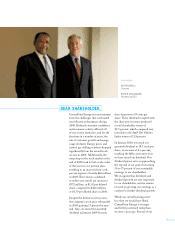
S H A R E H O L D E R L E T T E R
B OA R D O F D I R E C T O R S
Left to Right:
Milton Carroll
David M. McClanahan
Donald R. Campbell
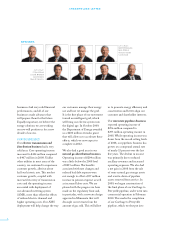
Left to Right:
Derrill Cody
O. Holcombe Crosswell
Michael P. Johnson
Janiece M. Longoria
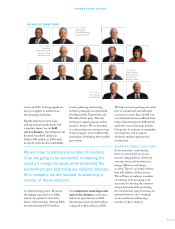
Left to Right:
Thomas F. Madison
Robert T. O’Connell
Susan O. Rheney
Michael E. Shannon
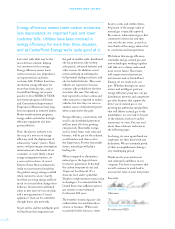
Left to Right:
Peter S. Wareing
Sherman M. Wolff