CenterPoint Energy 2009 Annual Report Download - page 6
Download and view the complete annual report
Please find page 6 of the 2009 CenterPoint Energy annual report below. You can navigate through the pages in the report by either clicking on the pages listed below, or by using the keyword search tool below to find specific information within the annual report.-
 1
1 -
 2
2 -
 3
3 -
 4
4 -
 5
5 -
 6
6 -
 7
7 -
 8
8 -
 9
9 -
 10
10 -
 11
11 -
 12
12 -
 13
13 -
 14
14 -
 15
15 -
 16
16 -
 17
17 -
18
-
19
-
20
-
21
-
22
-
23
-
24
-
25
-
26
-
27
-
28
-
29
-
30
-
31
-
32
-
33
-
34
-
35
-
36
-
37
-
38
-
39
-
40
-
41
-
42
-
43
-
44
-
45
-
46
-
47
-
48
-
49
-
50
-
51
-
52
-
53
-
54
-
55
-
56
-
57
-
58
-
59
-
60
-
61
-
62
-
63
-
64
-
65
-
66
-
67
-
68
-
69
-
70
-
71
-
72
-
73
-
74
-
75
-
76
-
77
-
78
-
79
-
80
-
81
-
82
-
83
-
84
-
85
-
86
-
87
-
88
-
89
-
90
-
91
-
92
-
93
-
94
-
95
-
96
-
97
-
98
-
99
-
100
-
101
-
102
-
103
-
104
-
105
-
106
-
107
-
108
-
109
-
110
-
111
-
112
-
113
-
114
-
115
-
116
-
117
-
118
-
119
-
120
-
121
-
122
-
123
-
124
-
125
-
126
-
127
-
128
-
129
-
130
-
131
-
132
-
133
-
134
-
135
-
136
-
137
-
138
-
139
-
140
-
141
-
142
-
143
-
144
-
145
-
146
-
147
-
148
-
149
-
150
 |
 |

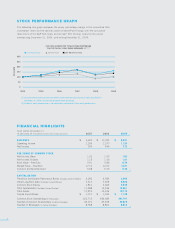
4
businesses had very solid financial
performances, and all of our
businesses made advances that
will prepare them for the future.
Equally important, we believe the
energy solutions we are working
on now will position us for a new
decade of success.
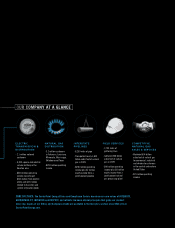
OUR BUSINESSES
Our electric transmission and
distribution business had a very
solid year. Core operating income
increased to $414 million compared
to $407 million in 2008. Unlike
other utilities in most areas of the
country, we continued to experience
customer growth, albeit at about
half our historic rate. is modest
customer growth, coupled with
increased recovery of transmission
costs and the operating income
associated with deployment of
our advanced metering system
(AMS), more than offset the effects
of reduced electric demand and
higher operating costs. Our AMS
deployment will help change the way
our customers manage their energy
use and how we manage the grid.
It is the first phase of our movement
toward an intelligent grid, which
will bring our electric system into
the digital age. In October 2009,
the Department of Energy awarded
us a $200 million stimulus grant
that will allow us to accelerate these
efforts, which we now expect to
complete in 2012.
We also had a good year in our
natural gas distribution business.
Operating income of $204 million
was a little below the 2008 level
of $215 million. e benefits
associated with rate changes and
reduced bad debt expense were
not enough to offset a $37 million
increase in pension expense as well
as increased labor costs. We are
pleased with the progress we have
made on the regulatory front and,
in particular, with a new rate design
approved in Minnesota that will
decouple our revenues from the
amount of gas sold. is will allow
us to promote energy efficiency and
conservation and better align our
customer and shareholder interests.
Our interstate pipelines business
reported operating income of
$256 million compared to
$293 million operating income in
2008. While operating income was
down from the record setting levels
of 2008, our pipelines business has
grown at a compound annual rate
of nearly 15 percent over the last
five years. e decline in income
was primarily due to reduced
ancillary revenues and increased
operating expenses. We also had
a net gain in 2008 from the sale
of some natural gas storage assets
and a write-down of pipeline
assets removed from service. In
2009, we began construction of
the final phase of our Carthage to
Perryville pipeline, and it went into
commercial operation in February
2010. is marks the completion
of our Carthage to Perryville
pipeline, which we first put into
S H A R E H O L D E R L E T T E R
Left to Right:
C. Gregory Harper
Joseph B. McGoldrick
James M. Dumler
Wayne D. Stinnett, Jr.
O F F I C E R S
Left to Right:
David M. McClanahan
Gary L. Whitlock
Thomas R. Standish
Scott E. Rozzell