CenterPoint Energy 2009 Annual Report Download - page 12
Download and view the complete annual report
Please find page 12 of the 2009 CenterPoint Energy annual report below. You can navigate through the pages in the report by either clicking on the pages listed below, or by using the keyword search tool below to find specific information within the annual report.-
 1
1 -
 2
2 -
 3
3 -
 4
4 -
 5
5 -
 6
6 -
 7
7 -
 8
8 -
 9
9 -
 10
10 -
 11
11 -
 12
12 -
 13
13 -
 14
14 -
 15
15 -
 16
16 -
 17
17 -
 18
18 -
 19
19 -
 20
20 -
 21
21 -
 22
22 -
23
-
24
-
25
-
26
-
27
-
28
-
29
-
30
-
31
-
32
-
33
-
34
-
35
-
36
-
37
-
38
-
39
-
40
-
41
-
42
-
43
-
44
-
45
-
46
-
47
-
48
-
49
-
50
-
51
-
52
-
53
-
54
-
55
-
56
-
57
-
58
-
59
-
60
-
61
-
62
-
63
-
64
-
65
-
66
-
67
-
68
-
69
-
70
-
71
-
72
-
73
-
74
-
75
-
76
-
77
-
78
-
79
-
80
-
81
-
82
-
83
-
84
-
85
-
86
-
87
-
88
-
89
-
90
-
91
-
92
-
93
-
94
-
95
-
96
-
97
-
98
-
99
-
100
-
101
-
102
-
103
-
104
-
105
-
106
-
107
-
108
-
109
-
110
-
111
-
112
-
113
-
114
-
115
-
116
-
117
-
118
-
119
-
120
-
121
-
122
-
123
-
124
-
125
-
126
-
127
-
128
-
129
-
130
-
131
-
132
-
133
-
134
-
135
-
136
-
137
-
138
-
139
-
140
-
141
-
142
-
143
-
144
-
145
-
146
-
147
-
148
-
149
-
150
 |
 |

10
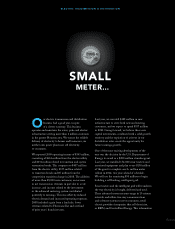
O
ur natural gas distribution business
performed very well last year.
Additional rate relief and new rate
designs helped us overcome slower growth due
to the downturn in the economy, but this was not
enough to fully overcome $37 million in increased
expenses due to a decline in value of our pension
assets in 2008. Operating income in 2009 was
$204 million compared to $215 million in 2008.
We continue to seek regulatory approval of rate
designs that allow most of our cost recovery
through the fixed monthly customer charge on
gas bills or otherwise protect us from continued
declines in use per customer. is decouples cost
recovery from the amount of gas consumed and
aligns the company’s interests with those of
our customers on energy conservation.
In January 2010, the Minnesota Public Utilities
Commission approved a pilot program with rate
mechanisms that separate our revenue from the
volume of natural gas sold. e commission
also authorized a rate increase of $41 million.
In Houston, we requested a rate increase of
$20 million. In February 2010, the Railroad
Commission of Texas issued its decision
authorizing a revenue increase of $5.1 million
annually, reflecting reduced depreciation rates
of $1.2 million, and a separate surcharge of
$0.9 million per year to recover Hurricane Ike
costs over three years.
We also continue to actively promote the
environmental and economic benefits of natural
gas, both in direct heating applications and as
a fuel for electric power plants. Natural gas is the
cleanest-burning fossil fuel and is abundantly
available in the U.S. When burned directly in
heating applications, natural gas transfers more
than 90 percent of its energy value, producing
more heat and less carbon.
Of course, using less energy is one of the very
best ways to help the environment and our
customers. In 2010, we are expanding our highly
successful conservation improvement programs in
Minnesota and Arkansas, and we are initiating
new offerings in Oklahoma.
Advancing technology solutions helps satisfy
customers and lower operating costs. For
example, we developed and applied for a patent
for an innovative device that enables us to replace
gas meters without interrupting a customer’s
service. is saves time, money and customer
inconvenience by eliminating the need to inspect
and re-light appliances following a natural gas
outage. We also plan to invest in new online
self-service enhancements to increase customer
satisfaction and reduce costs.
N A T U R A L G A S D I S T R I B U T I O N
MORE HEAT