Carnival Cruises 2007 Annual Report Download - page 8
Download and view the complete annual report
Please find page 8 of the 2007 Carnival Cruises annual report below. You can navigate through the pages in the report by either clicking on the pages listed below, or by using the keyword search tool below to find specific information within the annual report.-
 1
1 -
 2
2 -
 3
3 -
 4
4 -
 5
5 -
 6
6 -
 7
7 -
 8
8 -
 9
9 -
 10
10 -
 11
11 -
 12
12 -
 13
13 -
 14
14 -
 15
15 -
 16
16 -
 17
17 -
 18
18 -
 19
19 -
20
-
21
-
22
-
23
-
24
-
25
-
26
-
27
-
28
-
29
-
30
-
31
-
32
-
33
-
34
-
35
-
36
-
37
-
38
-
39
-
40
-
41
-
42
-
43
-
44
-
45
-
46
-
47
-
48
-
49
-
50
-
51
-
52
-
53
 |
 |

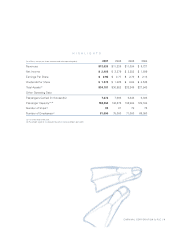
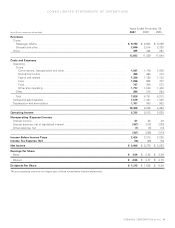
CONSOLIDATED STATEMENTS OF OPERATIONS
CARNIVAL CORPORATION & PLC | 5
Years Ended November 30,
(in millions, except per share data) 2007 2006 2005
Revenues
Cruise
Passenger tickets ............................................................. $ 9,792 $ 8,903 $ 8,399
Onboard and other ............................................................ 2,846 2,514 2,338
Other ........................................................................ 395 422 357
13,033 11,839 11,094
Costs and Expenses
Operating
Cruise
Commissions, transportation and other .......................................... 1,941 1,749 1,645
Onboard and other .......................................................... 495 453 412
Payroll and related .......................................................... 1,336 1,158 1,122
Fuel ...................................................................... 1,096 935 707
Food ..................................................................... 747 644 613
Other ship operating ........................................................ 1,717 1,538 1,465
Other ...................................................................... 296 314 254
Total ....................................................................... 7,628 6,791 6,218
Selling and administrative ........................................................ 1,579 1,447 1,335
Depreciation and amortization ..................................................... 1,101 988 902
10,308 9,226 8,455
Operating Income ............................................................... 2,725 2,613 2,639
Nonoperating (Expense) Income
Interest income ................................................................ 67 25 29
Interest expense, net of capitalized interest .......................................... (367 ) (312 ) (330)
Other expense, net ............................................................. (1 ) (8 ) (13)
(301 ) (295) (314)
Income Before Income Taxes ..................................................... 2,424 2,318 2,325
Income Tax Expense, Net ........................................................ (16 ) (39 ) (72)
Net Income .................................................................... $ 2,408 $ 2,279 $ 2,253
Earnings Per Share
Basic ........................................................................ $ 3.04 $ 2.85 $ 2.80
Diluted ....................................................................... $ 2.95 $ 2.77 $ 2.70
Dividends Per Share ............................................................. $ 1.375 $ 1.025 $ 0.80
The accompanying notes are an integral part of these consolidated financial statements.