Bridgestone 2013 Annual Report Download - page 5
Download and view the complete annual report
Please find page 5 of the 2013 Bridgestone annual report below. You can navigate through the pages in the report by either clicking on the pages listed below, or by using the keyword search tool below to find specific information within the annual report.-
 1
1 -
 2
2 -
 3
3 -
 4
4 -
 5
5 -
 6
6 -
 7
7 -
 8
8 -
 9
9 -
 10
10 -
 11
11 -
 12
12 -
 13
13 -
 14
14 -
 15
15 -
 16
16 -
17
-
18
 |
 |

Other
Europe
The Americas
Japan
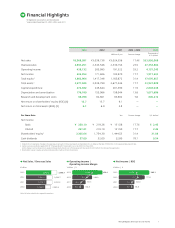
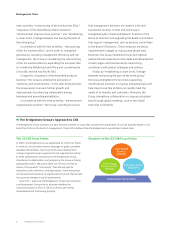
3Annual Report 2013 Operational Review
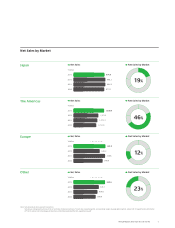
Note: Net sales exclude inter-segment transactions.
Net sales are categorized by the countries or territories of external customers. For net sales, operating prots, and operating margins by geographic segment, please refer to Supplementary Information
of FY 2013, whose URL is http://www.bridgestone.com/ir/library/result/pdf/e_h25_supplementary.pdf
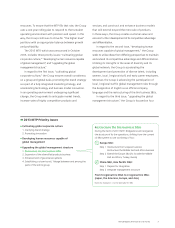
Net Sales by Market
19%
46%
12%
23%
Net Sales by Market
Net Sales by Market
Net Sales by Market
Net Sales by Market Net Sales
¥ billion
Net Sales
¥ billion
Net Sales
¥ billion
Net Sales
¥ billion
70X30.5
2013
2012
2011
2010
674.8
696.2
694.2
671.9
70X30.5
2013
2012
2011
2010
1,628.6
1,321.2
1,273.3
1, 212. 9
70X30.5
2013
2012
2011
2010
425.0
348.2
418.8
388.0
70X30.5
2013
2012
2011
2010
839.6
674.1
638.0
588.9