Bridgestone 2013 Annual Report Download - page 4
Download and view the complete annual report
Please find page 4 of the 2013 Bridgestone annual report below. You can navigate through the pages in the report by either clicking on the pages listed below, or by using the keyword search tool below to find specific information within the annual report.-
 1
1 -
 2
2 -
 3
3 -
 4
4 -
 5
5 -
 6
6 -
 7
7 -
 8
8 -
 9
9 -
 10
10 -
 11
11 -
 12
12 -
 13
13 -
 14
14 -
 15
15 -
16
-
17
-
18
 |
 |

Bridgestone Corporation2
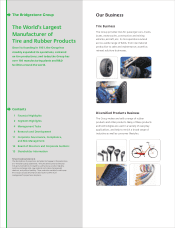
Tire Business
Tires: Tires and tire tubes for passenger cars, trucks, buses, construction and mining
vehicles, industrial machinery, agricultural machinery, aircraft, and motorcycles;
retreading materials and services; automotive maintenance and repair services;
tire raw materials; and other tire-related products
Diversied Products Business
Chemical and industrial products: Vehicle parts, polyurethane foam and related
products, electronic precision parts, industrial materials-related products, civil engineering
and construction materials and equipment, and others
Sporting goods: Golf balls, golf clubs, and other sporting goods
Bicycles: Bicycles, bicycle-related goods, and others
Other: Finance, and others
Note: Net sales exclude inter-segment transactions.
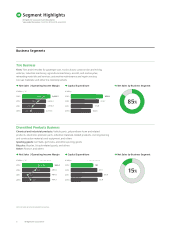
Business Segments
85%
15%
Net Sales / Operating Income Margin
¥ billion / %
Net Sales / Operating Income Margin
¥ billion / %
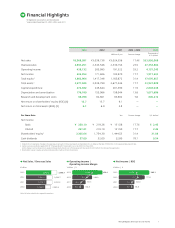
Segment Highlights
Bridgestone Corporation and Subsidiaries
Year ended December 31, 2013, 2012, 2011, and 2010
Capital Expenditure
¥ billion
Capital Expenditure
¥ billion
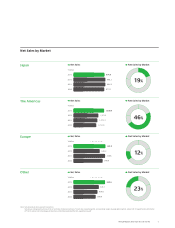
Net Sales by Business Segment
Net Sales by Business Segment
70X30.5
2013
2012
2011
2010 6.4
10.2
7.3
13.2%3,033.7
2,554.1
2,536.7
2, 377. 3
70X30.5
2013
2012
2011
2010 2.8
5.3
1.2
7.2%534.4
485.6
487.6
484.3
70X30.5
2013
2012
2011
2010
255.9
223.7
174.8
160.0
70X30.5
2013
2012
2011
2010
19.1
22.5
26.8
22.9