Best Buy 2008 Annual Report Download - page 7
Download and view the complete annual report
Please find page 7 of the 2008 Best Buy annual report below. You can navigate through the pages in the report by either clicking on the pages listed below, or by using the keyword search tool below to find specific information within the annual report.-
 1
1 -
 2
2 -
 3
3 -
 4
4 -
 5
5 -
 6
6 -
 7
7 -
 8
8 -
 9
9 -
 10
10 -
 11
11 -
 12
12 -
 13
13 -
 14
14 -
 15
15 -
 16
16 -
 17
17 -
 18
18 -
19
-
20
-
21
-
22
-
23
-
24
-
25
-
26
-
27
-
28
-
29
-
30
-
31
-
32
-
33
-
34
-
35
-
36
-
37
-
38
-
39
-
40
-
41
-
42
-
43
-
44
-
45
-
46
-
47
-
48
-
49
-
50
-
51
-
52
-
53
-
54
-
55
-
56
-
57
-
58
-
59
-
60
-
61
-
62
-
63
-
64
-
65
-
66
-
67
-
68
-
69
-
70
-
71
-
72
-
73
-
74
-
75
-
76
-
77
-
78
-
79
-
80
-
81
-
82
-
83
-
84
-
85
-
86
-
87
-
88
-
89
-
90
-
91
-
92
-
93
-
94
-
95
-
96
-
97
-
98
-
99
-
100
-
101
-
102
-
103
-
104
-
105
-
106
-
107
-
108
-
109
-
110
-
111
-
112
-
113
-
114
-
115
-
116
-
117
-
118
-
119
-
120
 |
 |

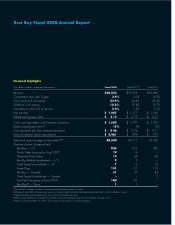
Revenue
(U.S. dollars in millions)
We have profitably delivered
13-percent average revenue
growth over the past 3 years*.
FY 08 $40,023
FY 07 $35,934
FY 06 $30,848
FY 05 $27,433
Diluted earnings per share
We have delivered 19-percent
average earnings per diluted share
growth over the past 3 years*.
FY 08 $3.12
FY 07 $2.79
FY 06 $2.27
FY 05 $1.86
International segment
revenue mix**
Domestic segment
revenue mix**
U.S. Best Buy market share
(calendar year data)
We believe that our focus on
customers, knowledgeable
employees and differentiated
shopping experience drove
continued market share gains.
2007 20%
2006 18%
2005 17%
2008 21%
S
e
r
v
i
c
e
s
A
p
p
l
i
a
n
c
e
s
S
o
f
t
w
a
r
e
E
n
t
e
r
t
a
i
n
m
e
n
t
H
o
m
e
O
f
f
i
c
e
C
o
n
s
u
m
e
r
E
l
e
c
t
r
o
n
i
c
s
5%
41%
6%
28%
20%
*Compound annual growth rate
**The Other category was less than
1 percent of revenue
Source: Company internal estimates
and NPD point-of-sale data
S
e
r
v
i
c
e
s
A
p
p
l
i
a
n
c
e
s
S
o
f
t
w
a
r
e
E
n
t
e
r
t
a
i
n
m
e
n
t
H
o
m
e
O
f
f
i
c
e
C
o
n
s
u
m
e
r
E
l
e
c
t
r
o
n
i
c
s
13%
39%
5%
30%
13%
Corporate responsibility
Our fi ve-year aspirations
• To be a global champion for human ingenuity
and opportunity.
• To be a global consumer advocate for consumer
electronics and technology.
• T o account socially and environmentally for our
brands and operations worldwide.
Our Corporate Responsibility Report can be accessed
at www.BestBuy.com by selecting “Responsibility.”
Best Buy Fiscal 2008 Annual Report | 5
Mallory
Store #611