Best Buy 2008 Annual Report Download - page 2
Download and view the complete annual report
Please find page 2 of the 2008 Best Buy annual report below. You can navigate through the pages in the report by either clicking on the pages listed below, or by using the keyword search tool below to find specific information within the annual report.-
 1
1 -
 2
2 -
 3
3 -
 4
4 -
 5
5 -
 6
6 -
 7
7 -
 8
8 -
 9
9 -
 10
10 -
 11
11 -
 12
12 -
 13
13 -
14
-
15
-
16
-
17
-
18
-
19
-
20
-
21
-
22
-
23
-
24
-
25
-
26
-
27
-
28
-
29
-
30
-
31
-
32
-
33
-
34
-
35
-
36
-
37
-
38
-
39
-
40
-
41
-
42
-
43
-
44
-
45
-
46
-
47
-
48
-
49
-
50
-
51
-
52
-
53
-
54
-
55
-
56
-
57
-
58
-
59
-
60
-
61
-
62
-
63
-
64
-
65
-
66
-
67
-
68
-
69
-
70
-
71
-
72
-
73
-
74
-
75
-
76
-
77
-
78
-
79
-
80
-
81
-
82
-
83
-
84
-
85
-
86
-
87
-
88
-
89
-
90
-
91
-
92
-
93
-
94
-
95
-
96
-
97
-
98
-
99
-
100
-
101
-
102
-
103
-
104
-
105
-
106
-
107
-
108
-
109
-
110
-
111
-
112
-
113
-
114
-
115
-
116
-
117
-
118
-
119
-
120
 |
 |

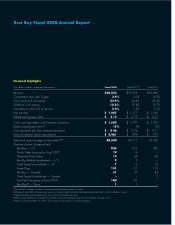
Financial highlights
(U.S. dollars in millions, except per share amounts) Fiscal 2008 Fiscal 2007 (1) Fiscal 2006
Revenue $40,023 $35,934 $30,848
Comparable store sales % gain 2.9% 5.0% 4.9%
Gross profi t as % of revenue 23.9% 24.4% 25.0%
SG&A as % of revenue 18.5% 18.8% 19.7%
Operating income as % of revenue 5.4% 5.6% 5.3%
Net earnings $ 1,407 $ 1,377 $ 1,140
Diluted earnings per share $ 3.12 $ 2.79 $ 2.27
Cash, cash equivalents and short-term investments $ 1,502 $ 3,793 $ 3,789
Debt-to-capitalization ratio (2) 15% 9% 10%
Cash dividends per share declared and paid $ 0.46 $ 0.36 $ 0.31
Value of common shares repurchased $ 3,461 $ 599 $ 772
Total retail square footage (in thousands) (3) (4) 48,580 43,511 35,526
Number of stores (at period end)
Best Buy — U.S. 923 822 742
Pacifi c Sales (acquired in fi scal 2007) 19 14 –
Magnolia Audio Video 13 20 20
Best Buy Mobile (stand-alone) — U.S. 9 5 –
Geek Squad (stand-alone) — U.S. 7 12 12
Future Shop 131 121 118
Best Buy — Canada 51 47 44
Geek Squad (stand-alone) — Canada – – 5
Five Star (5) (acquired in fi scal 2007) 160 135 –
Best Buy (5) — China 1 1 –
(1) Fiscal 2007 included 53 weeks. All other periods presented included 52 weeks
(2) Represents total debt (including current portion of long-term debt) divided by total capitalization (total debt + total shareholders’ equity)
(3) Represents total square footage of our stores at the end of each fi scal year
(4) Retail square footage for fi scal 2007 and 2006 have been adjusted to report all square footage on a gross basis
(5) Store count on December 31, 2007. China results are reported on a two-month lag basis.
Best Buy Fiscal 2008 Annual Report