Barnes and Noble 2015 Annual Report Download - page 7
Download and view the complete annual report
Please find page 7 of the 2015 Barnes and Noble annual report below. You can navigate through the pages in the report by either clicking on the pages listed below, or by using the keyword search tool below to find specific information within the annual report.-
 1
1 -
 2
2 -
 3
3 -
 4
4 -
 5
5 -
 6
6 -
 7
7 -
 8
8 -
 9
9 -
 10
10 -
 11
11 -
 12
12 -
 13
13 -
 14
14 -
 15
15 -
 16
16 -
 17
17 -
 18
18 -
19
-
20
-
21
-
22
-
23
-
24
-
25
-
26
-
27
-
28
-
29
-
30
-
31
-
32
-
33
-
34
-
35
-
36
-
37
-
38
-
39
-
40
-
41
-
42
-
43
-
44
-
45
-
46
-
47
-
48
-
49
-
50
-
51
-
52
-
53
-
54
-
55
-
56
-
57
-
58
-
59
-
60
-
61
-
62
-
63
-
64
-
65
-
66
-
67
-
68
-
69
-
70
-
71
-
72
-
73
-
74
-
75
-
76
-
77
-
78
-
79
-
80
 |
 |

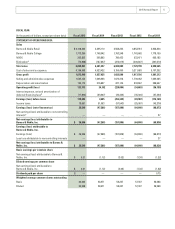
FISCAL YEAR
(In thousands of dollars, except per share data) Fiscal 2015 Fiscal 2014 Fiscal 2013 Fiscal 2012 Fiscal 2011
STATEMENT OF OPERATIONS DATA:
Sales
Barnes & Noble Retail $ 4,108,243 4,295,110 4,568,243 4,852,913 4,926,834
Barnes & Noble College 1,772,389 1,748,042 1,763,248 1,743,662 1,778,159
NOOK 263,833 505,862 780,433 933,471 695,182
Eliminationa (74,968) (167,657) (272,919) (400,847) (401,610)
Total sales 6,069,497 6,381,357 6,839,005 7,129,199 6,998,565
Cost of sales and occupancy 4,196,998 4,523,422 5,156,499 5,211,683 5,197,252
Gross profit 1,872,499 1,857,935 1,682,506 1,917,516 1,801,313
Selling and administrative expenses 1,545,152 1,606,936 1,675,376 1,739,452 1,629,465
Depreciation and amortization 194,174 216,807 227,134 232,667 228,647
Operating profit (loss) 133,173 34,192 (220,004) (54,603) (56,799)
Interest expense, net and amortization of
deferred financing feesb (17,890) (29,507) (35,345) (35,304) (57,350)
Earnings (loss) before taxes 115,283 4,685 (255,349) (89,907) (114,149)
Income taxes 78,687 51,953 (97,543) (25,067) (45,276)
Earnings (loss) (net of income tax) 36,596 (47,268) (157,806) (64,840) (68,873)
Net earnings (loss) attributable to noncontrolling
interestsc — — — — 37
Net earnings (loss) attributable to
Barnes & Noble, Inc. $ 36,596 (47,268) (157,806) (64,840) (68,836)
Earnings (loss) attributable to
Barnes & Noble, Inc.
Earnings (loss) $ 36,596 (47,268) (157,806) (64,840) (68,873)
Less loss attributable to noncontrolling interests — — — — 37
Net earnings (loss) attributable to Barnes &
Noble, Inc. $ 36,596 (47,268) (157,806) (64,840) (68,836)
Basic earnings per common share
Net earnings (loss) attributable to Barnes &
Noble, Inc. $ 0.21 (1.12) (3.02) (1.34) (1.22)
Diluted earnings per common share
Net earnings (loss) attributable to
Barnes & Noble, Inc. $ 0.21 (1.12) (3.02) (1.34) (1.22)
Dividends paid per share $ — — — — 0.75
Weighted average common shares outstanding
Basic 60,842 58,971 58,247 57,337 56,588
Diluted 60,928 58,971 58,247 57,337 56,588
2015 Annual Report 5