Barnes and Noble 2015 Annual Report Download - page 17
Download and view the complete annual report
Please find page 17 of the 2015 Barnes and Noble annual report below. You can navigate through the pages in the report by either clicking on the pages listed below, or by using the keyword search tool below to find specific information within the annual report.-
 1
1 -
2
-
3
-
4
-
5
-
6
-
 7
7 -
 8
8 -
 9
9 -
 10
10 -
 11
11 -
 12
12 -
 13
13 -
 14
14 -
 15
15 -
 16
16 -
 17
17 -
 18
18 -
 19
19 -
 20
20 -
 21
21 -
 22
22 -
 23
23 -
 24
24 -
 25
25 -
 26
26 -
 27
27 -
28
-
29
-
30
-
31
-
32
-
33
-
34
-
35
-
36
-
37
-
38
-
39
-
40
-
41
-
42
-
43
-
44
-
45
-
46
-
47
-
48
-
49
-
50
-
51
-
52
-
53
-
54
-
55
-
56
-
57
-
58
-
59
-
60
-
61
-
62
-
63
-
64
-
65
-
66
-
67
-
68
-
69
-
70
-
71
-
72
-
73
-
74
-
75
-
76
-
77
-
78
-
79
-
80
 |
 |

. million primarily due to lower Trade and Juvenile
sales, which is attributable to stronger titles in the prior
year.
tB&N College sales increased . million, or ., to
. billion during the weeks ended May ,
from . billion during the weeks ended May ,
, and accounted for . of total Company sales.
The inclusion of the rd week in the prior year con-
tributed . million of additional sales in fiscal .
Excluding the rd week, sales increased . million,
or . for the year. New store openings over the past
year increased sales by . million, partially offset by
closed stores, which decreased sales by . million.
Comparable store sales increased . or . million
for the comparable sales period. General merchandise
sales increased . million, or ., primarily due to
strong emblematic apparel sales, partially offset by .
million in decreased textbook sales as students contin-
ued to shift to lower priced rentals. General merchan-
dise sales have continued to increase as B&N College’s
product assortments continue to emphasize and reflect
the changing consumer trends and B&N College evolves
its presentation concepts and merchandising of product
in stores and online.
tNOOK sales decreased . million, or ., to
. million during the weeks ended May ,
from . million during the weeks ended May ,
, and accounted for . of total Company sales.
The inclusion of the rd week contributed . million
of additional sales in fiscal . Device and accessories
sales decreased . million, or ., to . mil-
lion on lower unit sales, partially offset by higher average
selling prices. Digital content sales decreased .
million, or ., to . million during the weeks
ended May , on lower unit sales, partially offset by
higher average selling prices.
tThe elimination represents sales from NOOK to B&N
Retail and B&N College on a sell-through basis. The
. million, or ., decrease versus the prior year
was due to the lower device sales at B&N Retail. NOOK
sales, net of elimination, accounted for . of total
Company sales.
In fiscal , the Company closed Barnes & Noble
stores, bringing its total number of B&N Retail stores
to with . million square feet. In fiscal , the
Company added B&N College stores and closed ,
ending the period with B&N College stores. As of May
, , the Company operated , stores in the states
and the District of Columbia.
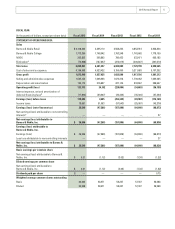
Cost of Sales and Occupancy
52 Weeks Ended 53 Weeks Ended
Dollars in
thousands May 2, 2015 % Sales May 3, 2014 % Sales
B&N Retail $2,796,521 68.1% $2,956,821 68.8%
B&N College 1,328,139 74.9% 1,310,673 75.0%
NOOK 147,306 55.8% 423,585 83.7%
Elimination (74,968) (28.4)% (167,657) (33.1)%
Total Cost of Sales
and Occupancy $4,196,998 69.1% $4,523,422 70.9%
The Company’s cost of sales and occupancy includes costs
such as merchandise costs, distribution center costs
(including payroll, freight, supplies, depreciation and
other operating expenses), rental expense, management
service agreement costs with schools, common area main-
tenance and real estate taxes, partially offset by landlord
tenant allowances amortized over the life of the lease.
Cost of sales and occupancy decreased . million, or
., to . billion in fiscal from . billion
in fiscal . Cost of sales and occupancy decreased as a
percentage of sales to . in fiscal from . in
fiscal . The change as a percentage of sales by segment
is as follows:
tB&N Retail cost of sales and occupancy decreased as a
percentage of sales to . in fiscal from .
in fiscal . This decrease was attributable to a higher
sales mix of higher margin core products (which exclude
NOOK® products), which decreased cost of goods sold
and occupancy as a percentage of sales by basis points,
lower core product markdowns, which decreased cost
of goods sold and occupancy as a percentage of sales
by basis points on a lower mix of bestselling titles,
increased vendor allowances on additional showroom
partnerships, which decreased cost of sales and occu-
pancy as a percentage of sales by basis points and a
. million reimbursement resulting from favorable
claims experience with a warranty service provider
(included in sales), which decreased cost of goods sold
and occupancy as a percentage of sales by basis points.
These favorable variances were partially offset by higher
occupancy costs, which increased cost of goods sold and
occupancy as a percentage of sales by basis points,
expense deleverage of basis points against the sales
decline and lower vendor settlements of basis points.
2015 Annual Report 15