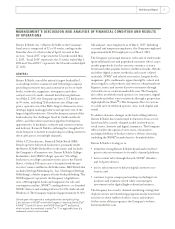
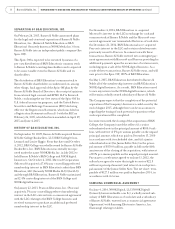
Barnes and Noble 2015 Annual Report Download - page 18
Download and view the complete annual report
Please find page 18 of the 2015 Barnes and Noble annual report below. You can navigate through the pages in the report by either clicking on the pages listed below, or by using the keyword search tool below to find specific information within the annual report.
tB&N College cost of sales and occupancy decreased as a
percentage of sales to . in fiscal from .
in fiscal on a favorable sales mix of higher mar-
gin textbook rentals and general merchandise, which
decreased cost of goods sold and occupancy as a percent-
age of sales by basis points and margin improvements,
primarily on textbook rentals, which decreased cost of
goods sold and occupancy as a percentage of sales by
basis points. These variances were partially offset by
higher occupancy costs resulting from contract renewals,
which increased cost of sales and occupancy as a percent-
age of sales by basis points and comparisons to a prior
year favorable LIFO adjustment of . million, which
resulted in an increase to cost of sales and occupancy as a
percentage of sales by basis points.
tNOOK cost of sales and occupancy decreased as a
percentage of sales to . in fiscal from . in
fiscal . This decrease is due to a higher mix of higher
margin content sales, lower occupancy, freight and
returns in the current year, as well as improved margin
on devices.
The current year includes a benefit from the adjustment
of lease accounting items to reflect the impact of the
Palo Alto relocations. This benefit, net of closing related
costs, of . million was primarily driven by the reversal
of previously deferred rent liabilities upon exiting the
facility. In addition, cost of goods sold and occupancy
included the recognition of a . million benefit on the
settlement of previously estimated and accrued parts and
components liabilities.
The current year also includes higher device recoverabil-
ity rates resulting from a new relationship with a third-
party purchaser of returned product.
The prior year included a reduction in cost of sales of
. million as the Company sold through devices at
higher average selling prices than originally anticipated,
and also was able to use parts and components, which
were previously written down, to build more devices to
meet higher than expected demand. The prior year also
included . million of inventory charges to write
down device development and other costs reflective of
the Company’s revised device strategy.
Gross Margin
52 Weeks Ended 53 Weeks Ended
Dollars in thousands
May 2,
2015 % Sales
May 3,
2014 % Sales
B&N Retail $1,311,722 31.9% $1,338,289 31.2%
B&N College 444,250 25.1% 437,369 25.0%
NOOK 116,527 61.7% 82,277 24.3%
Total Gross Margin $1,872,499 30.9% $1,857,935 29.1%
The Company’s consolidated gross margin increased .
million, or ., to . billion in fiscal from .
billion in fiscal . This increase was due to the matters
discussed above.
Selling and Administrative Expenses
52 Weeks Ended 53 Weeks Ended
Dollars in thousands
May 2,
2015 % Sales
May 3,
2014 % Sales
B&N Retail $ 989,223 24.1% $ 984,236 22.9%
B&N College 353,130 19.9% 322,819 18.5%
NOOK 202,799 107.4% 299,881 88.7%
Total Selling and
Administrative
Expenses $ 1,545,152 25.5% $ 1,606,936 25.2%
Selling and administrative expenses decreased .
million, or ., to . billion in fiscal from .
billion in fiscal . The current year includes .
million of separation related costs. Selling and administra-
tive expenses increased as a percentage of sales to .
in fiscal from . in fiscal . The change as a
percentage of sales by segment is as follows:
tB&N Retail selling and administrative expenses
increased as a percentage of sales to . in fiscal
from . in fiscal . This increase was primarily
due to deleveraging against the sales decline of basis
points, primarily due to store payroll given the com-
parable store sales decline. The increase also included
higher professional fees, which increased selling and
administrative expenses as a percentage of sales by
basis points (including separation-related costs and
legal fees), a pension settlement charge, which increased
selling and administrative expenses as a percentage of
sales by basis points and higher advertising costs,
which increased selling and administrative expenses as a
percentage of sales by basis points.
16 Barnes & Noble, Inc. MANAGEMENT’S DISCUSSION AND ANALYSIS OF FINANCIAL CONDITION AND RESULTS OF OPERATIONS continued


