Barnes and Noble 2006 Annual Report Download - page 15
Download and view the complete annual report
Please find page 15 of the 2006 Barnes and Noble annual report below. You can navigate through the pages in the report by either clicking on the pages listed below, or by using the keyword search tool below to find specific information within the annual report.-
 1
1 -
2
-
3
-
4
-
 5
5 -
 6
6 -
 7
7 -
 8
8 -
 9
9 -
 10
10 -
 11
11 -
 12
12 -
 13
13 -
 14
14 -
 15
15 -
 16
16 -
 17
17 -
 18
18 -
 19
19 -
 20
20 -
 21
21 -
 22
22 -
 23
23 -
 24
24 -
 25
25 -
26
-
27
-
28
-
29
-
30
-
31
-
32
-
33
-
34
-
35
-
36
-
37
-
38
-
39
-
40
-
41
-
42
-
43
-
44
-
45
-
46
-
47
-
48
-
49
-
50
-
51
-
52
-
53
-
54
-
55
-
56
-
57
-
58
-
59
-
60
 |
 |

Operating Profi t
The Company’s consolidated operating profi t increased
. million, or ., to . million in fi scal
from . million in fi scal . This increase was
primarily due to the matters discussed above.
Interest Expense, Net and Amortization of Deferred
Financing Fees
Interest income (expense), net, and amortization of
deferred fi nancing fees, increased . million, or
., to . million in fi scal from (.)
million in fi scal . The increase was due to reduced
average borrowings.
Income Taxes
Barnes & Noble’s eff ective tax rate in fi scal
decreased to . compared with . during
fi scal . The decrease in the eff ective tax rate was
primarily due to a decrease in the Company’s overall
eff ective state tax rate.
Minority Interest
Minority interest was . million in fi scal compared
with . million in fi scal , and relates to the
approximate outside interest in Calendar Club.
Income From Discontinued Operations
On October , , the Board of Directors of the
Company approved an overall plan for the complete dis-
position of all of the Company’s Class B common stock
in GameStop, the Company’s former video game operat-
ing segment. The plan was completed in November
with the distribution to the Company’s stockholders
of the GameStop Class B common stock. As a result,
GameStop is no longer a subsidiary of the Company
and, accordingly, the Company is presenting all histori-
cal results of operations of GameStop as discontinued
operations.
Earnings
As a result of the factors discussed above, the Company
reported consolidated net earnings of . million (or
. per share) during fi scal compared with net
earnings of . million (or . per share) during
fi scal .
52 WEEKS ENDED JANUARY 28, 2006 COMPARED
WITH 52 WEEKS ENDED JANUARY 29, 2005
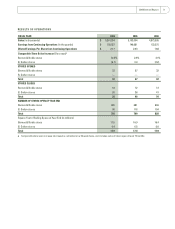
Sales
The Company’s sales increased . million, or .,
during fi scal to . billion from . billion
during fi scal . This increase was attributable to a
. million increase in sales at Barnes & Noble stores
and a . million increase in sales at Barnes & Noble.
com, off set by a . million decrease in sales at B.
Dalton stores.
Barnes & Noble store sales increased . million, or
., during fi scal to . billion from .
billion during fi scal and accounted for . of
total Company sales. The . increase in Barnes &
Noble store sales was attributable to an increase in com-
parable store sales of ., coupled with the opening of
new stores during fi scal , which contributed to a
. increase in square footage.
In fi scal , B. Dalton sales declined . and
represented . of total Company sales. The decrease
was primarily a result of store closings and a .
reduction in square footage, off set by an increase in
comparable store sales of . in fi scal .
In fi scal , the Company opened Barnes & Noble
stores and closed , bringing its total number of Barnes
& Noble stores to with . million square feet. The
Company closed B. Dalton stores, ending the period
with B. Dalton stores and . million square feet. As
of January , , the Company operated stores in
the fi fty states and the District of Columbia.
Cost of Sales and Occupancy
The Company’s cost of sales and occupancy includes
costs such as merchandise costs, distribution center
costs (including payroll, supplies, depreciation and
other operating expenses), rental expense, common
area maintenance, merchant association dues and lease-
required advertising, partially off set by landlord tenant
allowances amortized over the life of the lease.
Cost of sales and occupancy increased . million,
or ., to . billion in fi scal from .
billion in fi scal . As a percentage of sales, cost of
sales and occupancy decreased to . in fi scal
from . in fi scal . This decrease was due to less
purchases from book wholesalers at higher costs than
direct purchases from publishers, higher purchases
2006 Annual Report 13