Barnes and Noble 2006 Annual Report Download - page 14
Download and view the complete annual report
Please find page 14 of the 2006 Barnes and Noble annual report below. You can navigate through the pages in the report by either clicking on the pages listed below, or by using the keyword search tool below to find specific information within the annual report.-
 1
1 -
2
-
3
-
 4
4 -
 5
5 -
 6
6 -
 7
7 -
 8
8 -
 9
9 -
 10
10 -
 11
11 -
 12
12 -
 13
13 -
 14
14 -
 15
15 -
 16
16 -
 17
17 -
 18
18 -
 19
19 -
 20
20 -
 21
21 -
 22
22 -
 23
23 -
 24
24 -
25
-
26
-
27
-
28
-
29
-
30
-
31
-
32
-
33
-
34
-
35
-
36
-
37
-
38
-
39
-
40
-
41
-
42
-
43
-
44
-
45
-
46
-
47
-
48
-
49
-
50
-
51
-
52
-
53
-
54
-
55
-
56
-
57
-
58
-
59
-
60
 |
 |

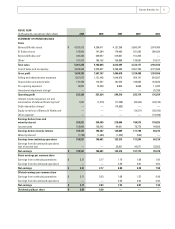
53 WEEKS ENDED FEBRUARY 3, 2007 COMPARED
WITH 52 WEEKS ENDED JANUARY 28, 2006
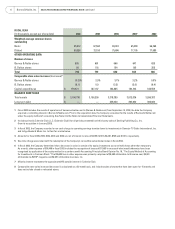
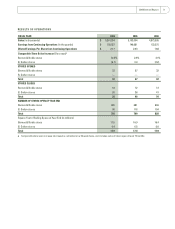
Sales
The Company’s sales increased . million, or .,
during fi scal to . billion from . billion
during fi scal . This increase was primarily attributable
to a . million increase in sales at Barnes & Noble
stores, a . million increase in Sterling Publishing
third party sales, off set by a . million decrease in
sales at B. Dalton stores.
Barnes & Noble store sales increased . million, or
., during fi scal to . billion from .
billion during fi scal and accounted for . of
total Company sales. The . increase in Barnes &
Noble store sales was primarily attributable to the inclu-
sion of the rd week in fi scal that contributed an
increase to sales of . million, new Barnes & Noble
stores that contributed an increase in sales of .
million, off set by closed stores that decreased sales by
. million and a . decrease in comparable store
sales, which decreased sales by . million.
In fi scal , B. Dalton sales declined . million
or . and represented . of total Company sales.
The decrease was primarily a result of store closings that
contributed to a decrease in sales of . million, a .
decrease in comparable store sales, which contributed to
a decrease in sales of . million, off set by the inclusion of
the rd week in fi scal that contributed an increase
to sales of . million.
In fi scal , the Company opened Barnes & Noble
stores and closed , bringing its total number of Barnes
& Noble stores to with . million square feet. The
Company closed B. Dalton stores, ending the period
with B. Dalton stores and . million square feet. As
of February , , the Company operated stores in
the fi fty states and the District of Columbia.
Cost of Sales and Occupancy
The Company’s cost of sales and occupancy includes
costs such as merchandise costs, distribution center
costs (including payroll, supplies, depreciation and
other operating expenses), rental expense, common
area maintenance, merchant association dues and lease-
required advertising, partially off set by landlord tenant
allowances amortized over the life of the lease.
Cost of sales and occupancy increased . million, or
., to . billion in fi scal from . billion
in fi scal . As a percentage of sales, cost of sales
and occupancy decreased to . in fi scal from
. in fi scal . This decrease was primarily attrib-
utable to favorable inventory shortage results and the
deep discounted selling price on J. K. Rowling’s Harry
Potter and the Half-Blood Prince in fi scal , off set by
the enhancement in the Company’s Member program
whereby adult hardcover discounts would increase by an
additional .
Selling and Administrative Expenses
Selling and administrative expenses increased .
million, or ., to . billion in fi scal from
. billion in fi scal . As a percentage of sales, sell-
ing and administrative expenses increased to . in
fi scal from . in fi scal . This increase was
primarily due to sales deleveraging due to negative com-
parable store sales as well as an increase in the amount
of stock-based compensation expense, primarily related
to the adoption of Statement of Financial Accounting
Standards (SFAS) No. (Revised), “Share-Based
Payment” (SFAS R), off set by a lower impairment
charge in fi scal related to property and equipment.
Depreciation and Amortization
Depreciation and amortization decreased . million,
or ., to . million in fi scal from .
million in fi scal . The decrease was primarily due
to lower depreciation on certain Barnes & Noble store
assets that became fully depreciated, off set by the higher
depreciation in the Company’s new distribution center
and accelerated depreciation in connection with the
closing of the Company’s Internet distribution center
in Memphis, Tennessee.
Pre-Opening Expenses
Pre-opening expenses increased . million, or .,
in fi scal to . million from . million in
fi scal . The increase in pre-opening expenses was
primarily the result of higher costs associated with the
locations of the stores opened in the fi rst quarter of
as well as an increase in new Barnes & Noble stores
opened during fi scal compared to the new Barnes
& Noble stores opened during fi scal .
12 Barnes & Noble, Inc. MANAGEMENT’S DISCUSSION AND ANALYSIS OF FINANCIAL CONDITION AND RESULTS OF OPERATIONS continued