Barnes and Noble 2002 Annual Report Download - page 5
Download and view the complete annual report
Please find page 5 of the 2002 Barnes and Noble annual report below. You can navigate through the pages in the report by either clicking on the pages listed below, or by using the keyword search tool below to find specific information within the annual report.-
 1
1 -
 2
2 -
 3
3 -
 4
4 -
 5
5 -
 6
6 -
 7
7 -
 8
8 -
 9
9 -
 10
10 -
 11
11 -
 12
12 -
 13
13 -
 14
14 -
 15
15 -
 16
16 -
17
-
18
-
19
-
20
-
21
-
22
-
23
-
24
-
25
-
26
-
27
-
28
-
29
-
30
-
31
-
32
-
33
-
34
-
35
-
36
-
37
-
38
-
39
-
40
-
41
-
42
-
43
-
44
-
45
-
46
-
47
-
48
-
49
-
50
-
51
-
52
-
53
-
54
-
55
-
56
-
57
-
58
-
59
 |
 |

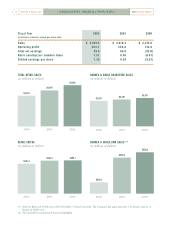
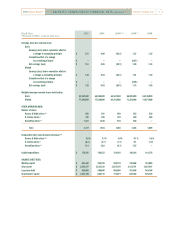
TOTAL RETAIL SALES
(in millions of dollars)
BARNES & NOBLE BOOKSTORE SALES
(in millions of dollars)
[ CONSOLIDATED FINANCIAL HIGHLIGHTS ]
4
2002 Annual ReportBarnes & Noble, Inc.
Fiscal Year 2002 2001 2000
(In millions of dollars, except per share data)
Sales $ 5,269.3 $ 4,870.4 $ 4,375.8
Operating profit 264.1 245.8 133.8
Total net earnings 99.9 64.0 (52.0)
Basic earnings per common share 1.51 0.96 (0.81)
Diluted earnings per share 1.39 0.94 (0.81)
(1) Sales for Barnes & Noble.com reflect December 31 fiscal year-ends. The Company has approximately a 36 percent interest in
Barnes & Noble.com.
(2) Not included in consolidated financial highlights.
$5,269
RETAIL EBITDA
(in millions of dollars)
BARNES & NOBLE.COM SALES
(1) (2)
(in millions of dollars)
2000 2001 2002 2000 2001 2002
$4,870
$4,376 $3,917
$3,749
$3,618
$422.8
$404.6
$320.1
$393.1
$392.2
$381.4
2000 2001 2002 2000 2001 2002