Bank of Montreal 2003 Annual Report Download - page 6
Download and view the complete annual report
Please find page 6 of the 2003 Bank of Montreal annual report below. You can navigate through the pages in the report by either clicking on the pages listed below, or by using the keyword search tool below to find specific information within the annual report.-
 1
1 -
 2
2 -
 3
3 -
 4
4 -
 5
5 -
 6
6 -
 7
7 -
 8
8 -
 9
9 -
 10
10 -
 11
11 -
 12
12 -
 13
13 -
 14
14 -
 15
15 -
 16
16 -
 17
17 -
18
-
19
-
20
-
21
-
22
-
23
-
24
-
25
-
26
-
27
-
28
-
29
-
30
-
31
-
32
-
33
-
34
-
35
-
36
-
37
-
38
-
39
-
40
-
41
-
42
-
43
-
44
-
45
-
46
-
47
-
48
-
49
-
50
-
51
-
52
-
53
-
54
-
55
-
56
-
57
-
58
-
59
-
60
-
61
-
62
-
63
-
64
-
65
-
66
-
67
-
68
-
69
-
70
-
71
-
72
-
73
-
74
-
75
-
76
-
77
-
78
-
79
-
80
-
81
-
82
-
83
-
84
-
85
-
86
-
87
-
88
-
89
-
90
-
91
-
92
-
93
-
94
-
95
-
96
-
97
-
98
-
99
-
100
-
101
-
102
-
103
-
104
-
105
-
106
-
107
-
108
-
109
-
110
 |
 |

BMO Financial Group 186th Annual Report 20032
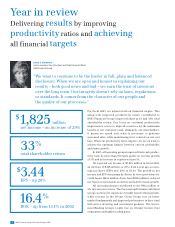
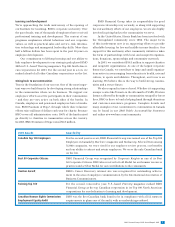
2003 Target 2003 Performance
Achieve EPS growth of 10% to 15% 28.4% (see page 16)
Achieve ROE of 14% to 15% 16.4% (see page 17)
Maintain an annual provision $455 million
for credit losses at or below (see page 24)
the 2002 level of $820 million
Maintain a Tier 1 Capital Ratio 9.55% (see page 43)
of at least 8.0%
Fellow shareholders,
When I accepted the responsibilities of Chairman and
Chief Executive Officer four years ago, we undertook a major
repositioning of BMO Financial Group to produce stronger
returns for investors and a more profitable and secure future
for the enterprise. Now, as we close the books on a year in
which BMO achieved all financial targets, I am pleased to
report that we are indeed delivering on our promise.
Since 1999, we have made a lot of tough choices. We have
exited businesses that were low return or lacked scale, includ-
ing corporate trust, global custody and our U.S. credit card
business. We have dramatically reduced risk-weighted assets
in our non-relationship corporate loan portfolio. And we have
sold 84 slower-growth branches through innovative deals that
safeguarded branches for customers and jobs for employees.
At the same time, we have implemented our Canada-U.S.
growth strategy with focus and consistency, making signifi-
cant investments in areas such as a major new technology
platform for our personal and commercial operations in
Canada, and direct brokerage, private banking and personal
and commercial banking acquisitions in the United States.
This major shift of our resources toward investments
with high growth potential tested shareholders’ patience as
we temporarily sacrificed revenues of more than $600 mil-
lion per year in order to set the stage for growth. Now, this
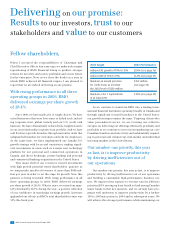
patience is being rewarded. With rising performance in all
three operating groups in 2003, BMO delivered earnings
per share growth of 28.4%. What is more, we raised our quar-
terly dividend by 16.7% during the year – a positive reflection
of our confidence in sustaining earnings growth. Investors
applauded our efforts, as BMO’s total shareholder return was
33% this fiscal year.
As we continue to transform BMO into a leading trans-
national financial institution operating broadly in Canada and
through significant focused franchises in the United States,
our growth strategy remains the same. Targeting clients who
value personalized service, we are focusing our collective
energies on delivering our offerings efficiently, prudently and
profitably as we continue to invest in strengthening our core
Canadian franchise and selectively and substantially expand-
ing in personal and commercial, mid-market and individual
investing markets in the United States.
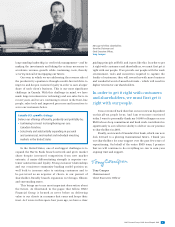
Our number-one priority, this year as last, is to improve
productivity by driving inefficiencies out of our operations
and building a sustainable high-performance business cul-
ture. We improved our expense-to-revenue ratio by 240 basis
points in 2003, moving up from fourth to third among Canada’s
major banks in this key measure, and we already have pro-
grams well underway to improve productivity by a further
150 to 200 basis points in 2004 and in subsequent years. We
will achieve this stronger performance while maintaining our
Delivering on our promise:
Results to our investors, trust to our
stakeholders and value to our customers
With rising performance in all three
operating groups in 2003,
BMO
delivered earnings per share
growth
of 28.4%.
Our number-one priority, this year
as last, is to improve productivity
by driving inefficiencies out of
our operations.