Bank of Montreal 2003 Annual Report Download
Download and view the complete annual report
Please find the complete 2003 Bank of Montreal annual report below. You can navigate through the pages in the report by either clicking on the pages listed below, or by using the keyword search tool below to find specific information within the annual report.-
 1
1 -
 2
2 -
 3
3 -
 4
4 -
 5
5 -
 6
6 -
 7
7 -
 8
8 -
 9
9 -
 10
10 -
 11
11 -
 12
12 -
13
-
14
-
15
-
16
-
17
-
18
-
19
-
20
-
21
-
22
-
23
-
24
-
25
-
26
-
27
-
28
-
29
-
30
-
31
-
32
-
33
-
34
-
35
-
36
-
37
-
38
-
39
-
40
-
41
-
42
-
43
-
44
-
45
-
46
-
47
-
48
-
49
-
50
-
51
-
52
-
53
-
54
-
55
-
56
-
57
-
58
-
59
-
60
-
61
-
62
-
63
-
64
-
65
-
66
-
67
-
68
-
69
-
70
-
71
-
72
-
73
-
74
-
75
-
76
-
77
-
78
-
79
-
80
-
81
-
82
-
83
-
84
-
85
-
86
-
87
-
88
-
89
-
90
-
91
-
92
-
93
-
94
-
95
-
96
-
97
-
98
-
99
-
100
-
101
-
102
-
103
-
104
-
105
-
106
-
107
-
108
-
109
-
110
 |
 |

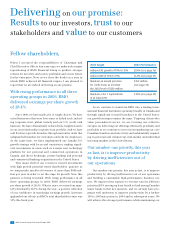
To our fellow shareholders,
This 186th Annual Report tells the story of the
financial performance we achieved in2003,
the ethical codes that guide our actions and how
we evaluate our performance. It is about the
strength that comes from balancing priorities:
Delivering results to investors, building trust
with our employees and the communities
where we do business, and creating value for
our customers. The pages in this report show
how we are delivering.
186th Annual Report 2003
Delivering
Table of contents
-
Page 1
... and how we evaluate our performance. It is about the strength that comes from balancing priorities: Delivering results to investors, building trust with our employees and the communities where we do business, and creating value for our customers. The pages in this report show how we are delivering... -
Page 2
...Financial Performance Review Operating Group Review Personal and Commercial Client Group Private Client Group Investment Banking Group Corporate Support, including Technology and Solutions Financial Condition Review Enterprise-Wide Capital Management Critical Accounting Policies Enterprise-Wide Risk... -
Page 3
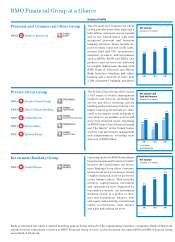
... deposit accounts, loans and credit cards, mutual fund and GIC investments, insurance products, and investments such as RRSPs, RESPs and RRIFs. Our products and services are delivered by a highly skilled team through 1,142 BMO Bank of Montreal and Harris Bank branches, telephone and online banking... -
Page 4
... of Sales Service. â-ª Ranking of number one for our Canadian Securitization unit in market share for asset-backed commercial paper conduit outstandings. â-ª Acquired Gerard Klauer Mattison, adding a solid U.S. equity research, sales and trading platform to our service offering as Harris Nesbitt... -
Page 5
... Measures (%) Five-year average annual total shareholder return Earnings per share growth Return on equity Revenue growth Provision for credit losses as a % of average net loans and acceptances Tier 1 Capital Ratio All ratios in this report are based on unrounded numbers. (a) Reported on a taxable... -
Page 6
... corporate trust, global custody and our U.S. credit card business. We have dramatically reduced risk-weighted assets in our non-relationship corporate loan portfolio. And we have sold 84 slower-growth branches through innovative deals that safeguarded branches for customers and jobs for employees... -
Page 7
... while containing costs, thereby securing instead of mortgaging our future. One way in which we are addressing the revenue side of the productivity equation is through a multi-faceted drive to improve and deepen customer loyalty in order to earn a larger share of each client's business. This is... -
Page 8
... the Private Client Group rose on better market fundamentals and improved performance in direct and full-service investing and investment products. The Investment Banking Group's results rose on stronger income trust origination and higher trading gains. BMO Financial Group 186th Annual Report 2003 -
Page 9
... member of senior management is held accountable for his or her actions to our shareholders, customers and employees, and to the communities where we operate. We hold our Board accountable to clear and verifiable standards. BMO has adopted a Charter of Expectations for our directors that sets out... -
Page 10
... accountable to our regulators, shareholders, customers and employees. Because our common shares are also listed in the United States, we have put in place policies and procedures to meet the requirements of the Sarbanes-Oxley Act. Our Chairman and CEO, Tony Comper, and our Chief Financial Officer... -
Page 11
... employee communication by the International Association of Business Communicators. For the second consecutive year, U.S.-based Training magazine ranked BMO Financial Group as the top Canadian corporation in its Top 100 North American corporations for our dedication to learning and development. BMO... -
Page 12
... channel. When it comes to delivering highly personalized financial service, Mosaik® MasterCard® is what it's all about. With this credit card, customers can choose the reward program, the interest rate plan, the travel insurance options and even the card design they want. We believe that clients... -
Page 13
... Banking Group serves corporate, institutional and government clients. In Canada, operating under the BMO Nesbitt Burns brand, our client base is large corporations and institutions across a broad range of industry sectors. In the United States, under the Harris Nesbitt brand, we serve middle-market... -
Page 14
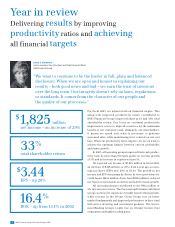
...performance is better, as BMO's average two-year TSR and three-year TSR were both third best of the six-bank Canadian peer group. Earnings per Share (EPS) Growth â-ª EPS rose 28% to a record $3.44 after growing 1% a year ago. Growth was driven by a lower provision for credit losses, business growth... -
Page 15
...% of Equity and Allowances for Credit Losses â-ª BMO's ratio was higher than the Canadian peer group average of 11.4% and the North American peer group average of 7.6%. 1999 2000 2001 2002 2003 Cash and Securities-to-Total Assets â-ª The cash and securities-to-total assets ratio increased to... -
Page 16
... and cash and securities-to-total assets ratio are both above our minimum targets. BMO's gross impaired loans and acceptances as a percentage of equity and allowance for credit losses improved by 3 percentage points from 2002 to 12.2%, but our ranking slipped to fifth among Canadian banks. The ratio... -
Page 17
...19 Total Shareholder Return Earnings per Share Growth Return on Equity Net Economic Profit Growth 41 Enterprise-Wide Strategic Management Economic and Financial Services Developments 43 44 45 53 54 Enterprise-Wide Capital Management Critical Accounting Policies Enterprise-Wide Risk Management Review... -
Page 18
... All groups improved more than 150 bps and BMO improved 2 260 bps â-ª 10% to 15% EPS growth â-ª ROE of 16% to 18% â-ª Provision for credit losses of $500 million or less â-ª Tier 1 Capital Ratio of at least 8% â-ª Improve cash productivity ratio by 150 bps to 200 bps âœ" âœ" (1) All EPS figures... -
Page 19
... dividend rate increased 16.7% from a year ago. Total Shareholder Return BMO's governing objective is to maximize the total return to shareholders and generate, over time, first-quartile total shareholder return (TSR) relative to our Canadian and North American peer groups. The five-year average... -
Page 20
... growth was primarily attributable to improving market fundamentals that boosted client trading activity and the market value of managed assets. Investment Banking Group benefited from lower net investment securities losses and higher equity origination fees and trading revenue. Corporate Support... -
Page 21
... to growth in NEP. Approximately three-quarters of NEP was attributable to Personal and Commercial Client Group and the balance to Investment Banking Group. Private Client Group was very close to generating breakeven NEP, as its cash return on equity was just slightly below its cost of capital, in... -
Page 22
...the only Canadian firm on the list) and ranked in the top 10 of the "Best 50 Corporate Citizens". â-ª Achieve the number one market share in business banking in Canada. â-ª Maintain leading investment banking positions in Canada and further build out our mid-market capabilities in the United States... -
Page 23
... Bank of Canada reduces the substantial amount of monetary stimulus in the system. The Canadian dollar is expected to change only modestly relative to the U.S. dollar, with support from positive trade balances offset by narrowing interest rate spreads. The economic environment should support growth... -
Page 24
...in Personal and Commercial Client Group and Private Client Group and to lower investment securities losses and higher equity origination fees and trading-related revenue in Investment Banking Group. â-ª The provision for credit losses declined $365 million due to improved credit performance over the... -
Page 25
... three months. The effect of currency fluctuations on our net investment in foreign operations is discussed in the Provision for Income Taxes section on page 26. Effects of the Weaker U.S. Dollar on BMO's 2003 Results ($ millions, except as noted) Canadian/U.S. dollar exchange rate (average) 2003... -
Page 26
... assets ($ millions) 2003 2002 Change $ % Net interest margin (in basis points) 2003 2002 Change P&C Canada P&C United States Personal and Commercial Client Group (P&C) Private Client Group (PCG) Investment Banking Group (IBG) Corporate Support, including Technology and Solutions (Corp) Total... -
Page 27
... and fees Deposit and payment service charges Trading revenues Lending fees Card fees Investment management and custodial fees Mutual fund revenues Securitization revenues Underwriting and advisory fees Investment securities gains (losses) Foreign exchange, other than trading Insurance income Other... -
Page 28
... Market Risk section on page 48 provides further information on tradingrelated revenues. Interest and Non-Interest Trading-Related Revenues ($ millions) For the year ended October 31 2003 2002 2001 2000 1999 Interest rates Foreign exchange Equities Other Total Reported as: Net interest income Non... -
Page 29
...the lower Canadian/U.S. dollar exchange rate reduced costs in 2003 by $181 million (- 2.9%); as such, these two factors offset each other. Higher performance-based compensation costs, associated with BMO's 29% increase in net income, increased expenses by $93 million (1.5%), and higher pension costs... -
Page 30
...and Commercial Client Group is BMO's largest operating group and its productivity ratio of 63.1% improved by 171 basis points from last year. There was volume-driven revenue growth in both Canada and the United States and controlled expense growth. Private Client Group's expense-to-revenue ratio was... -
Page 31
... October 31 Private Client Group Investment Banking Group Corporate Support, including Technology and Solutions Total Consolidated 2003 2002 2001 2003 2002 2001 2003 2002 2001 2003 2002 2001 2003 2002 2001 Net income Canada United States Other countries Total Business mix (%) Revenue... -
Page 32
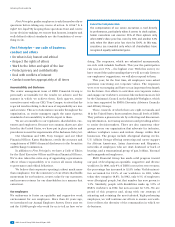
... our sales and service capabilities over the long term. We believe these capabilities will help drive the desired improvements in customer loyalty next year and beyond. Leverage our position in Commercial and Business Banking to continue to build momentum in balance sheet and market share growth... -
Page 33
... cash management and loans and deposits, through our branches and direct banking channels. For our Commercial mid-market clients, we provide a full suite of integrated advisory services and products that include senior debt financing, asset-based lending, mezzanine and private equity financing, cash... -
Page 34
... offering special lending rates and repayment options. We also launched our Premium Rate Savings Account for business in the fourth quarter, continued to build our cash management sales force and launched new cash management products. These initiatives helped expand our Business Banking market share... -
Page 35
... Canadian/U.S. dollar exchange rate, which reduced revenue in 2003 by $74 million. In Canada, the low interest rate environment supported consumer loan growth, and record home sales supported growth in mortgage lending. The introduction of our Mosaik MasterCard helped increase card services revenue... -
Page 36
... U.S. dollar reduced costs by $60 million. The group's non-interest expense-to-revenue ratio improved 171 basis points to 63.1%, as both Canadian and U.S. operations achieved productivity gains. Personal and Business Banking Market Share in Canada (%) Loans and Loan Growth in the United States 26... -
Page 37
... all of BMO Financial Group's wealth management businesses. Operating as BMO Private Client Group in Canada and The Harris in the United States, PCG serves a full range of North American client segments, from mainstream to ultra-high net worth, as well as select institutional market segments. We... -
Page 38
... to support them in serving clients and in attracting new clients. North American Direct Investing Description and Strategy North American Private Banking offers integrated banking, trust and investment management services to high and ultra-high net worth clients in Canada and the United States. We... -
Page 39
... service and technology costs, consolidating call centre and branch sites and reducing staff positions by 8%. The expense-to-revenue ratio was improved by 500 basis points from a year ago, consistent with our focus on improving productivity. The lower Canadian/U.S. dollar exchange rate reduced total... -
Page 40
... of Sales Service. â-ª Canadian Securitization unit ranked first in market share of asset-backed commercial paper conduit outstandings. Continue to build on the success of the Harris Nesbitt mid-market franchise. â-ª Acquired Gerard Klauer Mattison, adding a U.S. equity, sales and trading platform... -
Page 41
... for Equity Research. â-ª Create specialized sales and trading coverage teams for segments of the institutional market. Description and Strategy The Capital Markets line of business provides integrated debt, currency, interest rate, credit and commodity solutions to targeted wholesale, commercial... -
Page 42
...increase assets under management and thirdparty capital in line with market growth. International Description and Strategy The International line of business provides high-quality trade finance, correspondent banking, financing and other bank services to financial institutions and corporate clients... -
Page 43
... assets (after tax) Cash net income Net economic profit Return on equity (%) Cash return on equity (%) Non-interest expense-to-revenue ratio (%) Cash non-interest expense-to-revenue ratio (%) Average net interest margin (%) Average common equity Average assets Total risk-weighted assets Average... -
Page 44
... strategic planning, law, finance, internal audit, risk management, corporate communications, economics, human resources and learning. Our operating results include revenues and expenses associated with certain securitization activities, the hedging of foreign-source earnings, and activities related... -
Page 45
... at October 31 2003 2002 2001 2000 1999 Assets Cash resources Securities Net loans and acceptances Other assets Total Liabilities and Shareholders' Equity Deposits Other liabilities Subordinated debt Share capital Preferred Common Contributed surplus Retained earnings Total 19,860 19,305 17,656 18... -
Page 46
... to date. Amounts recorded in BMO's Consolidated Balance Sheet related to investments in securitization vehicles, deferred purchase price and cash deposits with securitization vehicles are disclosed in Note 7 on page 79 of the financial statements. 42 BMO Financial Group 186th Annual Report 2003 -
Page 47
...loan growth in Personal and Commercial Client Group was more than offset by a change in the asset mix due to lower corporate lending in Investment Banking Group. Our Total Capital Ratio, which is defined as total capital divided by risk-weighted assets, declined to 12.09% from 12.23% a year ago. The... -
Page 48
... market prices. In situations where listed prices or quotes are not available, management must estimate fair value using discounted cash flows or option pricing models. Management's estimates may affect the fair value and resulting gain or loss reported. Additional information about BMO's method... -
Page 49
...internal risk management policies and procedures, and compliance with risk-related regulatory requirements. Chairman and Chief Executive Officer (CEO) The CEO is directly accountable to the Board for all of BMO's risk-taking activities. Risk Management Committee and its sub-committees and Enterprise... -
Page 50
... total shareholder return Desired credit rating, given target business mix BMO's Risk Appetite Approved by the Board of Directors for each major category of risk and delegated to management in the lines of business through the CEO Two frameworks support the management of risk: change management... -
Page 51
... commercial accounts reviewed no less than annually. Corporate Audit reviews management processes as well as a representative sample of lending transactions for adherence to sound lending principles, practices, policies and procedures. In addition, BMO carries out regular portfolio sector reviews... -
Page 52
...12-month after-tax net income of a portfolio of assets, liabilities and off-balance sheet positions, measured at a 99% confidence level. Value at Risk (VaR) is measured for specific classes of risk in BMO's trading and underwriting activities: interest rate, currency, equity and commodity prices and... -
Page 53
... residual assets funded by common BMO Financial Group 186th Annual Report 2003 49 We also measure exposure to concentrations of market risk, such as changes in particular interest rates, foreign exchange rates, equity or commodity prices and their related implied volatilities. Effective controls... -
Page 54
... rate swaps, options and securities are the primary tools utilized to manage interest rate risk. Structural foreign exchange risk arises primarily from translation risk associated with the net investment in our U.S. operations, and from transaction risk associated with our U.S. dollar net income... -
Page 55
..., and related monitoring and change initiatives. Corporate Audit regularly reports on the effectiveness of operational risk internal controls and management processes to the CEO and to the Board's Audit Committee. Each line of business is responsible for managing its operational risk within the... -
Page 56
...risks include volatile economic market activity, changing client expectations, adverse business developments and relatively ineffective responses to industry changes. Risks to BMO's margins and volumes are categorized as business risk due to earnings volatility, and for each operating group, related... -
Page 57
..., rising mainly in the United States due to systems conversion and integration costs from the Joliet acquisition, volume growth, expansion initiatives and currency translation. The group's productivity ratio improved by 300 basis points. Private Client Group net income declined $36 million to $71... -
Page 58
... 31 Market Price per Common Share ($) High Low Close Common Dividends Dividends declared per share ($) Dividends paid per share ($) Dividend payout ratio (%) Dividend yield (%) Total Shareholder Return (%) Five-year average annual return One-year return Common Share Information Number outstanding... -
Page 59
... Cash resources Securities Loans and acceptances (net) Other assets Total assets Liabilities and Shareholders' Equity Deposits Other liabilities Subordinated debt Share capital Preferred Common Contributed surplus Retained earnings Total liabilities and shareholders' equity Average Daily Balances... -
Page 60
...growth (%) Net Interest Margin Total average assets Net interest margin (%) Canadian dollar net interest margin (%) U.S. dollar and other currencies net interest margin (%) Non-Interest Revenue Securities commissions and fees (a) Deposit and payment service charges Trading revenues Lending fees Card... -
Page 61
... Employee compensation Salaries Employee benefits Total employee compensation Premises and equipment Rental of real estate Premises, furniture and fixtures Property taxes Computers and equipment Total premises and equipment Other expenses Communications Business and capital taxes Professional fees... -
Page 62
...Average balances Average balances Assets Canadian Dollar Deposits with other banks Securities Loans Residential mortgages Non-residential mortgages Consumer instalment and other personal Credit cards Businesses and governments (a) Total loans Other non-interest bearing assets Total Canadian dollar... -
Page 63
...) due to change in: Average Average balance rate Total For the year ended October 31 Assets Canadian Dollar Deposits with other banks Securities Loans Residential mortgages Non-residential mortgages Consumer instalment and other personal Credit cards Businesses and governments Total loans Other... -
Page 64
..., 2002 credit information has been restated on the same basis. (d) There are no impaired securities purchased under resale agreements and no related allowances. (e) Aggregate balances are net of specific and general allowances; the consumer, commercial and corporate categories are stated net of... -
Page 65
... Corporate Loans (b)(d) Commercial mortgages Commercial real estate Construction (non-real estate) Retail trade Wholesale trade Agriculture Communications Manufacturing Mining Oil and gas Transportation Utilities Forest products Service industries Financial institutions Other (f)(g) Total commercial... -
Page 66
...-developed countries - Allocation of Recoveries by Market Consumer 26 Commercial and corporate 2 Net write-offs as a % of average loans and acceptances NA Table 16 Allocation of Allowance for Credit Losses - Segmented Information ($ millions, except as noted) Canada (c) United States (c) 2000 1999... -
Page 67
...Corporate (d)(e) Commercial mortgages Commercial real estate Construction (non-real estate) Retail trade Wholesale trade Agriculture Communications Manufacturing Mining Oil and gas Transportation Utilities Forest products Service industries Financial institutions Other Total commercial and corporate... -
Page 68
... reported based upon historical account balance behaviour. Capital Common Shareholders' Equity is reported as non-interest sensitive. Yields Yields are based upon the contractual interest rate in effect for the assets or liabilities on October 31, 2003. na - not applicable 64 BMO Financial Group... -
Page 69
... risk equivalent Risk weighting % Riskweighted balance 2002 Riskweighted balance Balance Balance sheet items Cash resources Securities Mortgages Other loans and acceptances Other assets Total balance sheet items Off-balance sheet items Guarantees and standby letters of credit Securities lending... -
Page 70
... accounts that would have been classified as demand deposits under U.S. reporting requirements. As at October 31, 2003, 2002 and 2001, total deposits payable on a fixed date included $18,872 million, $14,953 million and $21,362 million, respectively, of federal funds purchased and commercial paper... -
Page 71
... on sale of Bancomer Write-down of equity investments in CBOs Total non-interest revenue Provision for Credit Losses Increase of general allowance Total provision for credit losses Non-Interest Expense Acquisition-related costs Total non-interest expense Pre-tax impact of unusual items Income taxes... -
Page 72
... Basic Diluted Book value Market price High Low Close Financial Measures (%) (a) Five-year average total shareholder return Diluted earnings per share growth Diluted cash earnings per share growth Return on equity Cash return on equity Net economic profit growth Net income growth Revenue growth Non... -
Page 73
... financial reporting. Our system of internal control includes written communication of our policies and procedures governing corporate conduct and risk management; comprehensive business planning; effective segregation of duties; delegation of authority and personal accountability; careful selection... -
Page 74
... purchased (Note 15) Securities sold under repurchase agreements (Note 15) Other (Note 15) 20,715 5,611 8,255 23,765 11,259 69,605 Subordinated Debt (Note 16) Shareholders' Equity Share capital (Note 17) Contributed surplus (Note 19) Retained earnings 2,856 5,108 3 7,371 12,482 Total Liabilities... -
Page 75
... and payment service charges Trading revenues Lending fees Card fees Investment management and custodial fees Mutual fund revenues Securitization revenues (Note 7) Underwriting and advisory fees Investment securities gains (losses) (Note 3) Foreign exchange, other than trading Insurance income Other... -
Page 76
... a foreign operation (Note 3) Gain on cancellation of stock options granted on acquisition of an investment, net of applicable income tax (Note 17) Common shares repurchased for cancellation (Note 17) Share issue expense, net of applicable income tax Balance at End of Year Total Shareholders' Equity... -
Page 77
... Activities Net income Adjustments to determine net cash flows provided by (used in) operating activities Write-down of investment securities Net (gain) on sale of investment securities Net (increase) decrease in trading securities Provision for credit losses Gain on sale of securitized loans Change... -
Page 78
... foreign currencies are translated using the average exchange rate for the year. Note 2 Cash Resources 2003 2002 (Canadian $ in millions) Cash and non-interest bearing deposits with Bank of Canada and other banks Interest bearing deposits with banks Cheques and other items in transit, net Total... -
Page 79
...we purchase for resale over a short period of time. We report these securities at their market value and record the mark-to-market adjustments and any gains and losses on the sale of these securities in our Consolidated Statement of Income in trading revenues. Loan substitute securities are customer... -
Page 80
... recorded at cost net of unearned income and unamortized discounts. Unearned income includes interest and deferred loan fees. Interest income is recorded on an accrual basis, except for impaired loans, the treatment of which is described below. Securities purchased under resale agreements represent... -
Page 81
...regarding portfolio quality, business mix and economic as well as credit market conditions are also considered. Changes in the value of our loan portfolio due to credit-related losses are included in the provision for credit losses in our Consolidated Statement of Income. Change in Accounting Policy... -
Page 82
... information related to various commitments is as follows: (Canadian $ in millions) Contract amount 2003 Risk-weighted equivalent Contract amount 2002 Risk-weighted equivalent Credit Instruments Standby letters of credit and guarantees Securities lending Documentary and commercial letters of credit... -
Page 83
... the life of the securitization as the deferred purchase price becomes legally payable to us. For transfers of NHA-insured mortgages, we recorded a gain or loss in securitization revenues at the date of sale, based on the estimated net present value of the deferred purchase price at that time. For... -
Page 84
...loans Credit card loans Business and government loans 2003 2002 (Canadian $ in millions, except as noted) Residential mortgages Credit card loans Deferred purchase price Weighted-average life (in years) Prepayment rate (%) Impact of: 10% adverse change 20% adverse change Interest rate (%) Impact... -
Page 85
... then issue commercial paper to investors to fund the purchases. The sellers continue to service the transferred assets and absorb the first losses on the assets. We earn fees for providing structuring advice related to the securitizations as well as administrative fees for supporting the ongoing... -
Page 86
... counterparty making a payment if a credit event occurs, such as bankruptcy or credit rating change. The main risks associated with these instruments are the exposure to movements in interest rates, foreign exchange rates, credit ratings and securities or commodities prices, as applicable, and the... -
Page 87
...: (Canadian $ in millions) Trading Gross assets Gross liabilities 2003 Hedging Gross assets Gross liabilities Total Trading Hedging 2002 Total Net Net Net Net Net Net Interest Rate Contracts Swaps Forward rate agreements Futures Purchased options Written options Foreign Exchange Contracts... -
Page 88
... amounts do not represent assets or liabilities and therefore are not recorded in our Consolidated Balance Sheet. 2003 Trading Hedging Total Trading Hedging 2002 Total Interest Rate Contracts Over-the-counter Swaps Forward rate agreements Purchased options Written options $ 681,369 274,024... -
Page 89
... of Financial Institutions Canada. 2003 Replacement cost Credit risk equivalent Risk-weighted balance Replacement cost Credit risk equivalent 2002 Risk-weighted balance Interest Rate Contracts Swaps Forward rate agreements Purchased options Total interest rate contracts Foreign Exchange Contracts... -
Page 90
... the replacement cost of contracts from customers in the following industries: (Canadian $ in millions) Interest rate contracts 2003 2002 Foreign exchange contracts 2003 2002 Commodity contracts 2003 2002 Equity contracts 2003 2002 Credit contracts 2003 2002 Financial institutions Other Total $ 12... -
Page 91
... an equity research, sales and trading platform with offices in New York, Boston, Chicago, San Francisco and Los Angeles. The purchase price of $40 million consisted of cash consideration of $18 million and 504,221 of our common shares valued at $22 million. The number of common shares issued... -
Page 92
... following table: Personal and Commercial Client Group Corporate Support, including Technology and Solutions (Canadian $ in millions) Private Client Group Investment Banking Group Total Goodwill at beginning of year Acquisitions during the year Effects of foreign exchange and other Goodwill at... -
Page 93
... our corresponding claim is recorded as a loan in our Consolidated Balance Sheet. Securities Sold but not yet Purchased Securities sold but not yet purchased represent our obligation to deliver securities which we did not own at the time of sale. These obligations are recorded at their market value... -
Page 94
... reversed and an after-tax gain of $18 million was recorded directly in retained earnings when the options were cancelled. One of our subsidiaries, Bank of Montreal Securities Canada Limited ("BMSCL"), has issued various classes of non-voting shares that can be exchanged at the option of the holder... -
Page 95
...defined contribution pension plans expense) Total annual pension and other employee future benefit expenses Weighted-average assumptions used to determine benefits expense: Discount rate at beginning of year Expected long-term rate of return on plan assets Assumed overall health care cost trend rate... -
Page 96
... the benefit liability: Discount rate at end of year Rate of compensation increase Assumed overall health care cost trend rate Fair value of plan assets Fair value of plan assets at beginning of year Transition adjustment to reflect prior funding by U.S. subsidiary Actual return on plan assets Bank... -
Page 97
... as noted) Benefit liability Benefits expense Expected rate of return on assets (%) Impact of: 1% increase 1% decrease Discount rate (%) Impact of: 1% increase 1% decrease Rate of compensation increase (%) Impact of: .25% increase .25% decrease Assumed overall health care cost trend (%) Impact... -
Page 98
... surplus, in share capital. Employee compensation expense increased and net income decreased by $3 million in fiscal 2003 as a result of this change in accounting policy. We determine the fair value of options granted using the RolleGeske Option Pricing Model. The weighted-average fair value of... -
Page 99
... for income taxes Income tax (benefit) related to amortization of goodwill Shareholders' Equity Income tax expense (benefit) related to: Foreign currency gains (losses) on translation of net investments in foreign operations Other Total Components of Total Income Taxes Canada: Current income taxes... -
Page 100
...'s Board of Directors have a plan which requires directors to be paid at least 50% of their annual retainer in the form of either common shares of the Bank (purchased on the open market) or deferred share units. Directors may elect to take 100% of their 96 BMO Financial Group 186th Annual Report... -
Page 101
...the U.S. Securities Exchange Act of 1934 (United States only), in connection with the sale of Bre-X securities. Two of the proposed class actions in Canada have been dismissed as to BMO Nesbitt Burns Inc. All of the other actions are at a preliminary stage. Based upon information presently available... -
Page 102
... Canada. Set out below Condensed Consolidated Balance Sheet As at October 31 (Canadian $ in millions) Assets Cash Resources Securities Loans and customers' liability under acceptances, net of the allowance for credit losses Other Assets Total Assets Liabilities and Shareholders' Equity Deposits... -
Page 103
... Accumulated other comprehensive income is recorded as a separate component included in shareholders' equity under United States GAAP. Canadian GAAP does not have other comprehensive income. The accumulated balances related to each component of other comprehensive income, net of tax, are as follows... -
Page 104
... Foreign currency translation (iii) Total $ (44) (3) - $ (47) $ (40) (37) - $ (77) $ (17) (19) 81 $ 45 (i) Under United States GAAP, gains on all securitized assets are recorded at the date of the securitization. Under Canadian GAAP, prior to July 1, 2001, gains on sales of NHA-insured mortgages... -
Page 105
... Capital Markets (Holdings) Limited BMO Nesbitt Burns Limited (U.K.) Bank of Montreal Finance Ltd. Bank of Montreal Global Capital Solutions Ltd. Bank of Montreal Holding Inc. Bank of Montreal Insurance (Barbados) Limited Bank of Montreal Securities Canada Limited BMO Nesbitt Burns Corporation... -
Page 106
... and Chief Executive Officer BMO Financial Group Ronald H. Farmer Markham, Ontario Managing Director Mosaic Capital Partners Toronto David A. Galloway Toronto, Ontario Corporate Director and former President and Chief Executive Officer Torstar Corporation Eva Lee Kwok Vancouver, British Columbia... -
Page 107
... Burns and Head, Capital Markets Marnie J. Kinsley Executive Managing Director and Co-Head Cash Management Services L. Jacques Ménard Chairman, BMO Nesbitt Burns and President, BMO Financial Group, Quebec Tom V. Milroy Vice-Chair, BMO Nesbitt Burns and Global Head, Investment and Corporate Banking... -
Page 108
... the transfer, modification or reduction of current or expected risks from changes in rates and prices and can also be used for trading. Hedging A risk management technique used to neutralize or manage interest rate, foreign currency, equity, commodity or credit exposures arising from normal banking... -
Page 109
...888-453-0330 (Canada and the United States) or (416) 263-9394 (international). For all other shareholder inquiries, please write to Shareholder Services at the Corporate Secretary's Department, 21st Floor, 1 First Canadian Place, Toronto, Ontario M5X 1A1, e-mail to corp.secretary@ bmo.com, call (416... -
Page 110
...initiatives please contact our Corporate Communications Department. BMO Financial Group's news releases are available on our web site at www.bmo.com. Trade-mark/registered trade-mark of Bank of Montreal "Nesbitt Burns" is a registered trade-mark of BMO Nesbitt Burns Corporation Limited TM1/®1 Trade...