AutoNation 2006 Annual Report Download - page 20
Download and view the complete annual report
Please find page 20 of the 2006 AutoNation annual report below. You can navigate through the pages in the report by either clicking on the pages listed below, or by using the keyword search tool below to find specific information within the annual report.
Table of Contents
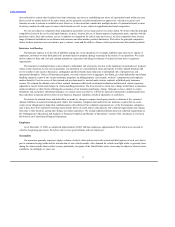
SELECTED FINANCIAL DATA
You should read the following Selected Financial Data in conjunction with “Management’s Discussion and Analysis of Financial
Condition and Results of Operations,” our Consolidated Financial Statements and Notes thereto and other financial information included
elsewhere in this Form 10-K.
Revenue $18,988.6 $18,729.5 $18,400.5 $17,602.7 $17,498.5
Income from continuing operations before income taxes $ 542.1 $ 625.2 $ 601.3 $ 600.8 $ 601.1
Net income $ 316.9 $ 496.5 $ 433.6 $ 479.2 $ 381.6
Basic earnings (loss) per share:
Continuing operations $ 1.47 $ 1.51 $ 1.47 $ 1.83 $ 1.17
Discontinued operations $ (.06) $ .38 $ .15 $ (.12) $ .03
Cumulative effect of accounting change(1) — — — $ (.05) —
Net income $ 1.41 $ 1.89 $ 1.63 $ 1.71 $ 1.20
Weighted average common shares outstanding 225.2 262.7 266.7 279.5 316.7
Diluted earnings (loss) per share:
Continuing operations $ 1.45 $ 1.48 $ 1.44 $ 1.78 $ 1.15
Discontinued operations $ (.06) $ .37 $ .15 $ (.11) $ .03
Cumulative effect of accounting change(1) — — — $ (.05) —
Net income $ 1.38 $ 1.85 $ 1.59 $ 1.67 $ 1.19
Weighted average common shares outstanding 229.3 268.0 272.5 287.0 321.5
Total assets $ 8,607.0 $ 8,824.5 $ 8,698.9 $ 8,823.1 $ 8,502.7
Long-term debt, net of current maturities $ 1,557.9 $ 484.4 $ 797.7 $ 808.5 $ 642.7
Shareholders’ equity $ 3,712.7 $ 4,669.5 $ 4,263.1 $ 3,949.7 $ 3,910.2
(1) During 2003, we recorded a $14.6 million ($9.1 million after-tax) cumulative effect of accounting change to reflect the deferral of
certain manufacturer allowances, primarily floorplan assistance, into inventory cost upon the adoption of Emerging Issues Task
Force Issue No. 02-16, “Accounting by a Customer (Including a Reseller) for Certain Consideration Received from a Vendor”, as
of January 1, 2003.
See Notes 9, 11, 12, 13, and 15 of Notes to Consolidated Financial Statements for discussion of shareholders’ equity, income
taxes, earnings per share, discontinued operations, and acquisitions, respectively, and their effect on comparability of year-to-year data.
See “Item 5. Market for the Registrant’s Common Equity and Related Stockholder Matters” for a discussion of our dividend policy.
19


