AutoNation 2006 Annual Report Download - page 19
Download and view the complete annual report
Please find page 19 of the 2006 AutoNation annual report below. You can navigate through the pages in the report by either clicking on the pages listed below, or by using the keyword search tool below to find specific information within the annual report.-
 1
1 -
2
-
3
-
4
-
5
-
6
-
7
-
8
-
 9
9 -
 10
10 -
 11
11 -
 12
12 -
 13
13 -
 14
14 -
 15
15 -
 16
16 -
 17
17 -
 18
18 -
 19
19 -
 20
20 -
 21
21 -
 22
22 -
 23
23 -
 24
24 -
 25
25 -
 26
26 -
 27
27 -
 28
28 -
 29
29 -
30
-
31
-
32
-
33
-
34
-
35
-
36
-
37
-
38
-
39
-
40
-
41
-
42
-
43
-
44
-
45
-
46
-
47
-
48
-
49
-
50
-
51
-
52
-
53
-
54
-
55
-
56
-
57
-
58
-
59
-
60
-
61
-
62
-
63
-
64
-
65
-
66
-
67
-
68
-
69
-
70
-
71
-
72
-
73
-
74
-
75
-
76
-
77
-
78
-
79
-
80
-
81
-
82
-
83
-
84
-
85
-
86
-
87
-
88
-
89
-
90
-
91
-
92
-
93
-
94
-
95
-
96
-
97
-
98
-
99
-
100
-
101
-
102
-
103
-
104
-
105
-
106
-
107
-
108
-
109
-
110
-
111
-
112
-
113
-
114
-
115
-
116
-
117
-
118
-
119
-
120
-
121
-
122
-
123
-
124
-
125
-
126
-
127
-
128
-
129
-
130
-
131
-
132
-
133
-
134
-
135
-
136
-
137
-
138
-
139
 |
 |

Table of Contents
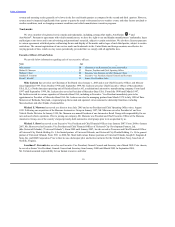
The following graph and table compare the cumulative total stockholder return on our common stock from December 31, 2001
through December 31, 2006 with the performance of: (i) the Standard & Poor’s 500 Stock Index and (ii) the Standard & Poor’s Specialty
Stores Index. We have created these comparisons using data supplied by Research Data Group, Inc. The comparisons reflected in the
graph and table are not intended to forecast the future performance of our stock and may not be indicative of future performance. The
graph and table assume investments of $100 in our stock and each index on December 31, 2001.
AutoNation Inc. 100.00 101.87 148.99 155.80 176.24 172.91
S&P 500 100.00 77.90 100.24 111.15 116.61 135.03
S&P Specialty Stores 100.00 88.89 119.69 125.92 148.72 180.78
18