Anthem Blue Cross 2004 Annual Report Download - page 29
Download and view the complete annual report
Please find page 29 of the 2004 Anthem Blue Cross annual report below. You can navigate through the pages in the report by either clicking on the pages listed below, or by using the keyword search tool below to find specific information within the annual report.-
 1
1 -
2
-
3
-
4
-
5
-
6
-
7
-
8
-
9
-
10
-
11
-
12
-
13
-
14
-
15
-
16
-
17
-
18
-
 19
19 -
 20
20 -
 21
21 -
 22
22 -
 23
23 -
 24
24 -
 25
25 -
 26
26 -
 27
27 -
 28
28 -
 29
29 -
 30
30 -
 31
31 -
 32
32 -
 33
33 -
 34
34 -
 35
35 -
 36
36
 |
 |

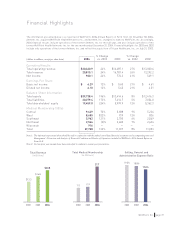
(dollarsinmillions,exceptpersharedata)
2004
$ 20,460.9
20,815.1
960.1
$ 6.29
6.10
$ 39,738.4
20,279.4
19,459.0
9,649
8,655
5,962
2,546
916
27,728
Note1: Theinformationpresentedaboveshouldbereadinconjunctionwiththeauditedconsolidatedfinancialstatementsandaccompanyingnotesand
Management’sDiscussionandAnalysisofFinancialConditionandResultsofOperationsincludedinWellPoint’s2004AnnualReporton
Form10-K.
Note2: Certainprioryearamountshavebeenreclassifiedtoconformtocurrentyearpresentation.
$13.3
$16.8
$20.8
200420032002 200420032002 200420032002
Total Revenue
(in Billions)
11.1 11.9
27.7
Total Medical Membership
(in Millions)
19.3% 18.8%
17.0%
Selling, General and
Administrative Expense Ratio
0
5
10
15
20
25
0
5
10
15
20
25
30
0
5
10
15
20
$13.3
$16.8
$20.8
200420032002 200420032002 200420032002
Total Revenue
(in Billions)
11.1 11.9
27.7
Total Medical Membership
(in Millions)
19.3% 18.8%
17.0%
Selling, General and
Administrative Expense Ratio
0
5
10
15
20
25
0
5
10
15
20
25
30
0
5
10
15
20
$13.3
$16.8
$20.8
200420032002 200420032002 200420032002
Total Revenue
(in Billions)
11.1 11.9
27.7
Total Medical Membership
(in Millions)
19.3% 18.8%
17.0%
Selling, General and
Administrative Expense Ratio
0
5
10
15
20
25
0
5
10
15
20
25
30
0
5
10
15
20