Amtrak 2014 Annual Report Download - page 15
Download and view the complete annual report
Please find page 15 of the 2014 Amtrak annual report below. You can navigate through the pages in the report by either clicking on the pages listed below, or by using the keyword search tool below to find specific information within the annual report.-
 1
1 -
2
-
3
-
4
-
 5
5 -
 6
6 -
 7
7 -
 8
8 -
 9
9 -
 10
10 -
 11
11 -
 12
12 -
 13
13 -
 14
14 -
 15
15 -
 16
16 -
 17
17 -
 18
18 -
 19
19 -
 20
20 -
 21
21 -
 22
22 -
 23
23 -
 24
24 -
 25
25 -
26
-
27
-
28
-
29
-
30
-
31
-
32
-
33
-
34
-
35
-
36
-
37
-
38
-
39
-
40
-
41
-
42
-
43
-
44
-
45
-
46
-
47
-
48
-
49
-
50
-
51
-
52
-
53
-
54
-
55
-
56
-
57
-
58
-
59
-
60
-
61
-
62
-
63
-
64
-
65
-
66
-
67
-
68
-
69
-
70
-
71
-
72
 |
 |

Accumulated
Other Other
Preferred Common Paid-In Accumulated Com
p
rehensive
Stock Stock Ca
p
ital Deficit Loss Total
Balance at September 30, 2012 10,939,699$ 93,857$ 25,208,088$ (28,994,005)$ (797,444)$ 6,450,195$
Federal paid-in capital – – 1,489,772 – – 1,489,772
Net loss – – – (1,275,554) – (1,275,554)
Total pension and other postretirement
b
enefit items – – – – 425,678 425,678
Balance at September 30, 2013 10,939,699 93,857 26,697,860 (30,269,559) (371,766) 7,090,091
Federal paid-in capital – – 1,511,208 – – 1,511,208
Net loss – – –
(
1,082,612
)
–
(
1,082,612
)
Total pension and other postretirement
b
enefit items – – – –
(
117,083
)
(
117,083
)
Balance at September 30, 2014 10,939,699$ 93,857$ 28,209,068$
(
31,352,171
)
$
(
488,849
)
$ 7,401,604$
See accompanying notes.
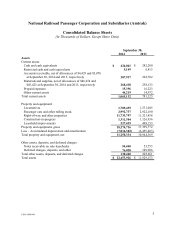
National Railroad Passenger Corporation and Subsidiaries (Amtrak)
Consolidated Statements of Changes in Capitalization
(In Thousands of Dollars)
7 1509-1694994