Ally Bank 2014 Annual Report Download - page 7
Download and view the complete annual report
Please find page 7 of the 2014 Ally Bank annual report below. You can navigate through the pages in the report by either clicking on the pages listed below, or by using the keyword search tool below to find specific information within the annual report.-
 1
1 -
 2
2 -
 3
3 -
 4
4 -
 5
5 -
 6
6 -
 7
7 -
 8
8 -
 9
9 -
 10
10 -
 11
11 -
 12
12 -
 13
13 -
 14
14 -
 15
15 -
 16
16 -
 17
17 -
 18
18 -
19
-
20
-
21
-
22
-
23
-
24
-
25
-
26
-
27
-
28
-
29
-
30
-
31
-
32
-
33
-
34
-
35
-
36
-
37
-
38
-
39
-
40
-
41
-
42
-
43
-
44
-
45
-
46
-
47
-
48
-
49
-
50
-
51
-
52
-
53
-
54
-
55
-
56
-
57
-
58
-
59
-
60
-
61
-
62
-
63
-
64
-
65
-
66
-
67
-
68
-
69
-
70
-
71
-
72
-
73
-
74
-
75
-
76
-
77
-
78
-
79
-
80
-
81
-
82
-
83
-
84
-
85
-
86
-
87
-
88
-
89
-
90
-
91
-
92
-
93
-
94
-
95
-
96
-
97
-
98
-
99
-
100
-
101
-
102
-
103
-
104
-
105
-
106
-
107
-
108
-
109
-
110
-
111
-
112
-
113
-
114
-
115
-
116
-
117
-
118
-
119
-
120
-
121
-
122
-
123
-
124
-
125
-
126
-
127
-
128
-
129
-
130
-
131
-
132
-
133
-
134
-
135
-
136
-
137
-
138
-
139
-
140
-
141
-
142
-
143
-
144
-
145
-
146
-
147
-
148
-
149
-
150
-
151
-
152
-
153
-
154
-
155
-
156
-
157
-
158
-
159
-
160
-
161
-
162
-
163
-
164
-
165
-
166
-
167
-
168
-
169
-
170
-
171
-
172
-
173
-
174
-
175
-
176
-
177
-
178
-
179
-
180
-
181
-
182
-
183
-
184
-
185
-
186
-
187
-
188
 |
 |

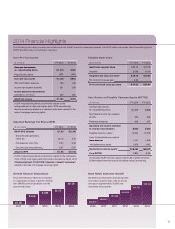
2010 2011 2012 2013 2014
$8.3B
$5.7B
$4.9B
$3.6B
$1.2B
20102009 2011 2012 2013 2014
389,043
497,965
621,604
783,537
909,130
303,673
(
$
millions)
F
Y 2014
F
Y 2013
Cor
Cor
ep
e p
re-
re
tax
tax
in
in
com
com
e,
e,
ex. repositionin
g
item
s
$
1,619
$
850
R
epos
i
t
i
on
i
n
g
i
tem
s
1
(18
(18
7)
7)
(24
(24
4)
4)
C
or
e p
re-tax income $ 1
,43
2
$
606
O
ID amortization ex
p
ens
e
186
249
3
2
1
(
59
)
Inc
Inc
ome
ome
(l
(l
oss
oss
)f
) f
rom
rom
di
di
sco
sco
nti
nti
nue
nue
d
d
ope
rations, net o
f
ta
x
225
(
55
)
G
AAP net inc
ome
$
1
,
150
$
36
1
(
1
)
2014 repositioning items are primarily related to the
e
xtin
g
uishment of hi
g
h-cost le
g
acy debt. 2013 repositionin
g
i
tems are pr
i
mar
ily
re
l
ate
d
to a va
l
uat
i
on wr
i
te
d
own re
l
ate
d
to t
h
e
sale o
f
mort
g
a
g
e servicin
g
ri
g
hts
.
($
millions
)
F
Y 2014
F
Y 2013
C
ore
p
re-tax income,
e
x. repositionin
g
items
$1
$ 1
61
,61
9
9
$8
$ 8
50
50
N
orma
li
ze
d
i
ncome tax ex
pen
se
a
t 34
%
550
2
89
Preferred dividends
268
26
7
O
peratin
g
net income availa
ble
to
com
mon
sh
are
holder
s
$
800
$
294
T
ang
ibl
e common equ
i
t
y
1
1
3
,
522 12
,
69
5
L
ess:
U
namort
i
ze
d
core or
i
g
i
na
l
iss
iss
ue
ue
dis
dis
cou
cou
nt
nt
1
,
44
1
1,
656
N
et deferred ta
x a
sse
t
1
,
926
1
,
61
5
N
orma
li
ze
d
common e
q
u
ity
2
$ 1
$
0,1
0,
54
5
$ 9
$9
,42
,
4
C
or
e R
O
T
C
E
7.9
%
3.1
%
(
1) Includes GAAP Common equity less
$
1.3B of preferred stock
.
(
2) Normalized common equity calculated usin
g
2 period av
g
.
(
$
per share)
F
Y 2014
F
Y 2013
GAA
GAA
Pb
P b
ook
ook
va
va
lue
lue
pe
pe
rs
r s
har
har
e
e
$
29.4
6
$
27.00
G
oodwil
l
(
0.06
)
(
0.06
)
T
ang
ibl
e
b
oo
k
va
l
ue per s
h
ar
e
$ 2
9.4
0
$ 2
6.94
P
ro-forma
C
hina sale gai
n
0
.
82
-
P
ro-forma book value
p
er shar
e
$
30.23
$
26.94
(
$
p
er share
)
FY
20
14
FY
20
1
3
G
AAP EP
S
(
diluted
)
$
1.8
3
$
(
1.64
)
D
iscontinued operatio
ns,
net
of
ta
x
(
0.47
)
0.1
3
OID expense, net of t
ax
0.2
5
0.3
9
O
ne time items
/
repositionin
g
1
0
.
07
0
.
97
Ad
j
usted EP
S
$ 1
.6
8
$
(
0.14
)
(
1
)
2014 repositioning items are primarily related to the extinguish-
m
ent of hi
g
h-cost le
g
acy debt and certain discrete tax items. 2013
rep
rep
osi
osi
tio
tio
nin
nin
gi
g i
tem
tem
sa
s a
re
re
pri
pri
mar
mar
ily
ily
re
re
lat
lat
ed
ed
to
to
av
a v
alu
alu
ati
ati
on
on
wri
wri
te
te
dow
dow
n
n
related to the sale o
f
mort
g
a
g
e servicin
g
ri
g
hts
.
2014 Financial Highlights
Growth Channel Originations Bank Retail Customer Growth
Core Pre-Tax Income
Core Return on Tangible Common Equity (ROTCE)
Tangible Book Value
Adjusted Earnings Per Share (EPS)
V