Allstate 2005 Annual Report Download - page 4
Download and view the complete annual report
Please find page 4 of the 2005 Allstate annual report below. You can navigate through the pages in the report by either clicking on the pages listed below, or by using the keyword search tool below to find specific information within the annual report.-
 1
1 -
 2
2 -
 3
3 -
 4
4 -
 5
5 -
 6
6 -
 7
7 -
 8
8 -
 9
9 -
 10
10 -
 11
11 -
 12
12 -
 13
13 -
 14
14 -
 15
15 -
16
-
17
-
18
-
19
-
20
-
21
-
22
 |
 |
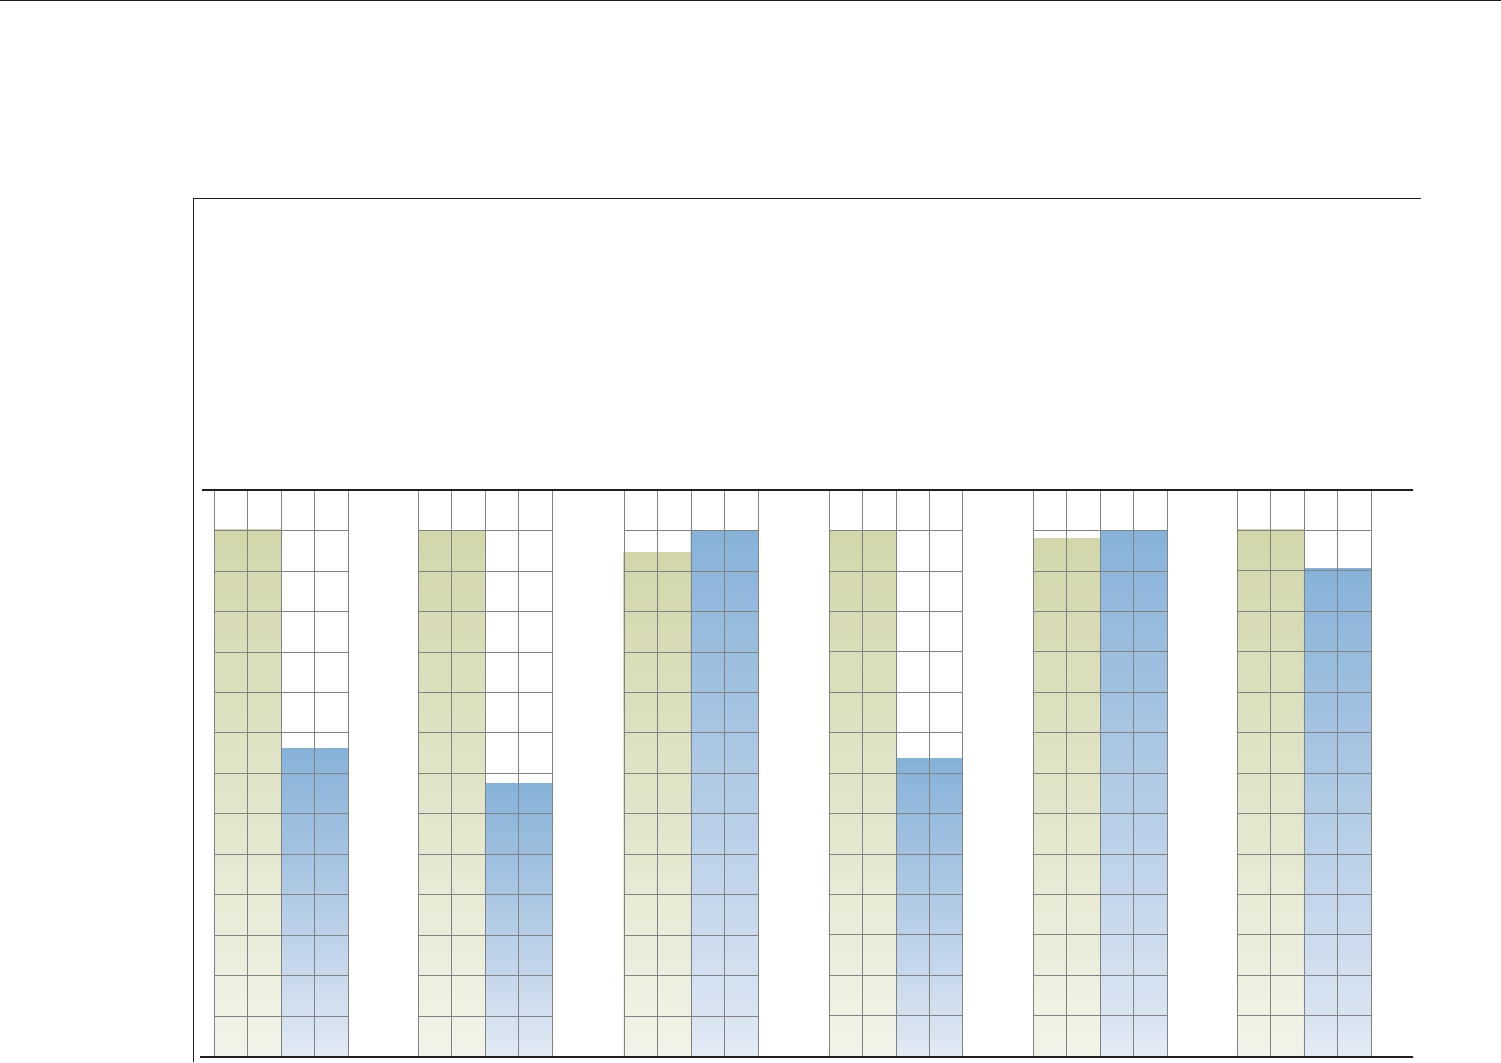
20052004 20052004 20052004 20052004 20052004 20052004
(in dollars) (in billions) (in billions) (percent) (in dollars) (in billions)
$4.54
$2.64
$3.1
$1.6
$33.9
$35.4 $28.62 $29.08 $21.8
$20.2
15.0%
8.4%
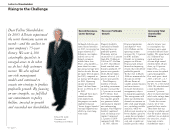
Highlights: In 2005,
Allstate incurred
$5.7 billion in losses
primarily related to
the three devastating
hurricanes in the Gulf
states. Nevertheless,
we generated net
income of $1.8
billion, which pro-
duced an 8.4 percent
return on equity.
We also repurchased
43.8 million shares at
a cost of $2.5 billion.
Our total shareholder
return of 7.0 percent
outpaced the S&P
500 in 2005, as it has
in each of the last
five years, and as
it has cumulatively
since we became a
public company in
June 1993.
Net Income per
Diluted Share
Net income per diluted
share, which decreased 41.9
percent in 2005, divides net
income by the number of
weighted average diluted
shares outstanding. It
demonstrates net income
during the year that is
attributable to each share
of stock.
Operating Income*
In 2005, operating income
was $1.6 billion. This is a
common measure used by
the investment community
to analyze our results.
Operating income reveals
trends in our insurance and
financial services business
that may be obscured by
business decisions and
economic developments
unrelated to the insurance
underwriting process.
Revenues
Revenues rose 4.3 percent to
$35.4 billion in 2005.
Revenues indicate Allstate’s
total premium and invest-
ment results.
Return on Equity
Return on average
beginning and ending
period shareholders’ equity,
which measures how well
Allstate used shareholders’
equity to generate net
income, decreased to
8.4 percent in 2005 from
15.0 percent in 2004.
Shareholders’ Equity
Shareholders’ equity, which
is the company’s total assets
minus total liabilities,
indicates the book value
of the ownership interest
of Allstate shareholders.
It declined 7.5 percent
in 2005 to $20.2 billion
from $21.8 billion in 2004,
reflecting a net return
of capital to shareholders
through dividends and
share repurchasing.
Measuring our Performance
*Measures we use that are not
based on accounting principles
generally accepted in the
United States (non-GAAP)
are defined and reconciled to
the most directly comparable
GAAP measure, and operating
measures are defined in the
“Definitions of non-GAAP and
Operating Measures” section
on page 17 of this report.
Financial Highlights
Book Value per Diluted
Share Excluding the Net
Impact of Unrealized Net
Capital Gains on Fixed
Income Securities*increased
by 1.6 percent in 2005.
This measure, commonly
used by insurance investors
as a valuation technique,
is shareholders’ equity less
unrealized net capital gains
on fixed income securities
divided by the number of
diluted shares
outstanding
on December 31.