Alcoa 2009 Annual Report Download - page 5
Download and view the complete annual report
Please find page 5 of the 2009 Alcoa annual report below. You can navigate through the pages in the report by either clicking on the pages listed below, or by using the keyword search tool below to find specific information within the annual report.-
 1
1 -
 2
2 -
 3
3 -
 4
4 -
 5
5 -
 6
6 -
 7
7 -
 8
8 -
 9
9 -
 10
10 -
 11
11 -
 12
12 -
 13
13 -
 14
14 -
 15
15 -
 16
16 -
17
-
18
-
19
-
20
-
21
-
22
-
23
-
24
-
25
-
26
-
27
-
28
-
29
-
30
-
31
-
32
-
33
-
34
-
35
-
36
-
37
-
38
-
39
-
40
-
41
-
42
-
43
-
44
-
45
-
46
-
47
-
48
-
49
-
50
-
51
-
52
-
53
-
54
-
55
-
56
-
57
-
58
-
59
-
60
-
61
-
62
-
63
-
64
-
65
-
66
-
67
-
68
-
69
-
70
-
71
-
72
-
73
-
74
-
75
-
76
-
77
-
78
-
79
-
80
-
81
-
82
-
83
-
84
-
85
-
86
-
87
-
88
-
89
-
90
-
91
-
92
-
93
-
94
-
95
-
96
-
97
-
98
-
99
-
100
-
101
-
102
-
103
-
104
-
105
-
106
-
107
-
108
-
109
-
110
-
111
-
112
-
113
-
114
-
115
-
116
-
117
-
118
-
119
-
120
-
121
-
122
-
123
-
124
-
125
-
126
-
127
-
128
-
129
-
130
-
131
-
132
-
133
-
134
-
135
-
136
-
137
-
138
-
139
-
140
-
141
-
142
-
143
-
144
-
145
-
146
-
147
-
148
-
149
-
150
-
151
-
152
-
153
-
154
-
155
-
156
-
157
-
158
-
159
-
160
-
161
-
162
-
163
-
164
-
165
-
166
-
167
-
168
-
169
-
170
-
171
-
172
-
173
-
174
-
175
-
176
-
177
-
178
 |
 |

Alcoa 2009 Annual Report and Form 10-K 3
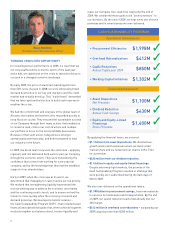
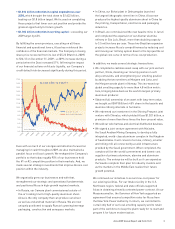
• $1.816 billion reduction in capital expenditures over
2008, which brought the total down to $1.622 billion,
beating our $1.8 billion target. We focused on completing
those projects that lower our cost position and provide the
greatest opportunity for future growth.
• $1.302 billion reduction in working capital – exceeding our
2009 target by 63%.
By fulfi lling the seven promises, executing on all these
fi nancial and operational levers, Alcoa has reinforced the
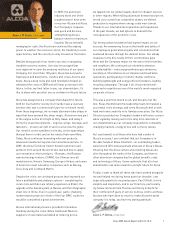
confi dence of the fi nancial markets. The Company’s closing
share price recovered from its low of $5.22 (March 6, 2009)
to $16.12 on December 31, 2009 – a 209% increase during a
period when the Dow increased 57%. Affi rming the impact
of our fi nancial actions on Alcoa’s liquidity, our Company’s
credit default risk decreased signifi cantly during this period.
Even with so much of our energies and attention focused on
managing for cash throughout 2009, we also maintained a
parallel focus on Alcoa’s growth. We reshaped the Company’s
portfolio so that today roughly 90% of our businesses hold
the #1 or #2 competitive position in their markets. And, we
made several strategic investments that improve Alcoa’s cost
position within the industry.
We organically grew our businesses and with that,
strengthened our strategic and operational fundamentals
and positioned Alcoa in high-growth regional markets.
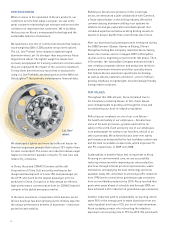
• In Russia, our Samara plant commissioned a state-of-
the-art coating line for high-quality aluminum sheet.
Alcoa is the only company that can produce can sheet
as well as end and tab material in Russia. We are now
uniquely positioned to supply Russia’s growing beverage
packaging, construction and aerospace markets.
• In China, our Bohai plant in Qinhuangdao launched
the largest lithographic sheet line in China. Alcoa now
produces the highest quality aluminum sheet in China for
the printing, transportation, electronics and packaging
industries.
• In Brazil, we commissioned the new bauxite mine in Juruti
and completed the expansion of our Alumar alumina
refi nery in São Luís, Brazil, more than doubling capacity
to 3.5 million tons per year. These two Brazilian expansion
projects increase Alcoa’s competitiveness by reducing cost
and moving our refi ning system down to the top quartile on
the global cost curve in terms of low-cost production.
In addition, we made several strategic transactions:
• We completed a cashless asset swap with our joint venture
partner, Orkla, divesting our minority position in soft
alloy extrusions, and strengthening our smelting position
by adding the two smelters at Mosjøen and Lista, and
the Mosjøen anode plant in Norway. This increased our
global smelting capacity to more than 4.8 million metric
tons, bringing Alcoa back as the world’s largest primary
aluminum producer.
• Obtained full ownership of an asset with long-term value,
we bought out BHP Billiton’s 45% share in the bauxite and
alumina refi ning interests in Suriname.
• We redeemed our investment in the Shining Prospect joint
venture with Chinalco, which yielded Alcoa $1.021 billion, a
premium of more than three times the then-present value.
• We sold our wire harness and electrical distribution business.
• We signed a joint venture agreement with Ma’aden,
the Saudi Arabian Mining Company, to develop a fully
integrated, world-class aluminum complex in the Kingdom
of Saudi Arabia. It will consist of a mine, refi nery, smelter
and rolling mill all connected by a solid infrastructure
provided by the Saudi government. When completed, the
complex will be the world’s preeminent and lowest-cost
supplier of primary aluminum, alumina and aluminum
products. The enterprise will be built so it can expand as
the Saudis complete their plan for industry clusters and
as the markets in the Middle East realize their future
growth potential.
We continued our initiatives to secure low-cost power for
our existing facilities. For our Intalco facility in the U.S.
Northwest region, federal and state offi cials supported
Alcoa in obtaining a heavily contested power contract. At our
Massena smelter, the Governor of New York supported an
agreement that ensured competitive rates for Alcoa from
the New York Power Authority. In return, we committed to
curtail only half of our local smelting capacity and to retain
part of the workforce to keep the plant ready for re-start and
prepare it for future modernization.
ALCOA DEBT & EQUITY
Source: Bloomberg
ALCOA DEBT & EQUITY
CO & QU
ALCOA DEBT & EQUITY
AL
CO
A
DE
BT
&
E
QU
IT
Y
Y
Y
T
I
U
U
Q
E
&
&
T
B
B
E
D
A
A
O
O
C
L
L
A
A
Source: Bloomber
g
g
Source Bloomberg
g
e
b
m
o
l
B
e
c
u
o
S
Alcoa Share Price ($)
Alcoa July 2013 Debt Yield (%)
1/1/09
2/1/09
3/1/09
4/1/09
5/1/09
6/1/09
7/1/09
8/1/09
9/1/09
10/1/09
11/1/09
12/1/09
12/31/09
4.00
5.00
6.00
7.00
8.00
9.00
10.00
11.00
12.00
13.00
14.00
15.00
16.00
17.00