Air Canada 2008 Annual Report Download - page 17
Download and view the complete annual report
Please find page 17 of the 2008 Air Canada annual report below. You can navigate through the pages in the report by either clicking on the pages listed below, or by using the keyword search tool below to find specific information within the annual report.
2008 Management’s Discussion and Analysis
17
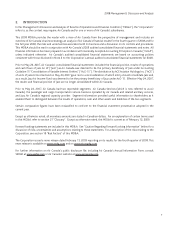
System passenger revenues decreased 0.6% from the fourth quarter of 2007
In response to historically high fuel prices, on June 17, 2008, Air Canada announced capacity reductions for the fall and
winter schedule. In the fourth quarter of 2008, Air Canada reduced its capacity by 7.8% from the fourth quarter of 2007.
Compared to the fourth quarter of 2007, passenger revenues decreased $14 million or 0.6% to $2,182 million in the fourth
quarter of 2008 due to a decline in traffic. In the fourth quarter of 2008, passenger revenues in North America decreased
$47 million or 3.3% while passenger revenues in the international market increased $33 million or 4.3% compared to the
fourth quarter of 2007. The decrease in passenger revenue due to lower traffic was partly offset by additional revenue
from increased fares and fuel surcharges. The capacity reduction on many routes also led to an improvement in the mix of
economy fares which contributed to a higher average system yield. Factors contributing to the year-over-year change in
fourth quarter system passenger revenues included:
• In the fourth quarter of 2008, adjusted system yield improved 6.2% (excludes a favourable adjustment of $26
million in the fourth quarter of 2007) from the fourth quarter of 2007, reflecting yield growth in all markets. The
yield improvement was mainly due to higher fares and increased fuel surcharges and a favourable foreign exchange
impact from foreign denominated revenues. A more favourable fare mix in the economy cabin was also a factor
in the yield improvement from the fourth quarter of 2007. Yield in the premium cabin declined 1.1%, reflecting
decreases in all markets with the exception of the domestic and other markets, which is comprised of services to the
South Pacific, Caribbean, Mexico and South American markets (“other markets”).
• A weaker Canadian dollar in the fourth quarter of 2008, which increases the Canadian dollar value of sales in
foreign countries, had a positive impact on foreign currency denominated revenues, accounting for an increase of
$35 million to fourth quarter 2008 passenger revenues compared to the fourth quarter of 2007. Approximately 1.6
percentage points of the year-over-year yield improvement in the fourth quarter of 2008 was due to the favourable
impact of foreign exchange.
• Inthefourthquarterof2008,AirCanadareducedoverallcapacityby7.8%fromthefourthquarterof2007.Capacity
decreases were recorded in all markets with the exception of other markets. Approximately half of the capacity
reduction was achieved through the reduction of frequencies on existing routes and cancellation of service on a small
number of unprofitable routes, with the remainder through the increased use of smaller aircraft in the fleet.
• Inthefourthquarterof2008,atrafcdeclineof5.3%waslessthanthecapacitydecreaseof7.8%resultingina
2.1 percentage point improvement in passenger load factor from the fourth quarter of 2007. Passenger load factor
improvements were recorded in all markets with the exception of other markets where capacity increases were not
fully met by traffic improvements.
• Inthefourthquarterof2008,adjustedRASMincreased9.1%fromthefourthquarterof2007dueprimarilyto
the growth in yield but also to the passenger load factor improvement. RASM improvements were reflected in all
markets.
The table below describes year-over-year percentage changes in fourth quarter passenger revenues, capacity, traffic,
passenger load factor, yield and RASM.
Fourth Quarter 2008
Versus
Fourth Quarter 2007
Passenger
Revenue
% Change
Capacity
(ASMs)
% Change
Traffic
(RPMs)
% Change
Passenger
Load Factor
pp Change
Yield
% Change
RASM
% Change
Canada (1.2) (4.3) (3.3) 0.9 2.2 3.2
US transborder (7.7) (15.0) (12.8) 2.0 5.9 8.6
Atlantic 5.3 (7.2) (3.7) 2.9 9.5 13.5
Pacific 5.2 (17.7) (10.4) 7.1 17.4 27.9
Other 1.0 10.2 7.3 (2.0) (5.9) (8.4)
Other(1) 17.4 10.2 7.3 (2.0) 9.3 6.5
System (0.6) (7.8) (5.3) 2.1 4.9 7.8
System (1) 0.5 (7.8) (5.3) 2.1 6.2 9.1
(1) System and Other passenger revenue, yield and RASM percentage changes include the impact of removing $26 million from the fourth quarter of 2007. This
adjustment was related to a change in accounting estimates.


