Aetna 2013 Annual Report Download - page 19
Download and view the complete annual report
Please find page 19 of the 2013 Aetna annual report below. You can navigate through the pages in the report by either clicking on the pages listed below, or by using the keyword search tool below to find specific information within the annual report.-
 1
1 -
2
-
3
-
4
-
5
-
6
-
7
-
8
-
 9
9 -
 10
10 -
 11
11 -
 12
12 -
 13
13 -
 14
14 -
 15
15 -
 16
16 -
 17
17 -
 18
18 -
 19
19 -
 20
20 -
 21
21 -
 22
22 -
 23
23 -
 24
24 -
 25
25 -
 26
26 -
 27
27 -
 28
28 -
 29
29 -
30
-
31
-
32
-
33
-
34
-
35
-
36
-
37
-
38
-
39
-
40
-
41
-
42
-
43
-
44
-
45
-
46
-
47
-
48
-
49
-
50
-
51
-
52
-
53
-
54
-
55
-
56
-
57
-
58
-
59
-
60
-
61
-
62
-
63
-
64
-
65
-
66
-
67
-
68
-
69
-
70
-
71
-
72
-
73
-
74
-
75
-
76
-
77
-
78
-
79
-
80
-
81
-
82
-
83
-
84
-
85
-
86
-
87
-
88
-
89
-
90
-
91
-
92
-
93
-
94
-
95
-
96
-
97
-
98
-
99
-
100
-
101
-
102
-
103
-
104
-
105
-
106
-
107
-
108
-
109
-
110
-
111
-
112
-
113
-
114
-
115
-
116
-
117
-
118
-
119
-
120
-
121
-
122
-
123
-
124
-
125
-
126
-
127
-
128
-
129
-
130
-
131
-
132
-
133
-
134
-
135
-
136
-
137
-
138
-
139
-
140
-
141
-
142
-
143
-
144
-
145
-
146
-
147
-
148
-
149
-
150
-
151
-
152
-
153
-
154
-
155
-
156
 |
 |

Annual Report- Page 13
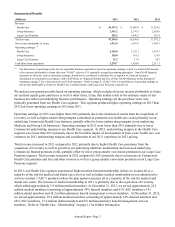
Operating earnings for 2013 declined by $33.5 million compared to 2012, primarily reflecting lower underwriting
margins (calculated as premiums less current and future benefits) in our group life insurance products due to higher
claim incidence, partially offset by higher underwriting margins in our disability products. Operating earnings for
2012 increased $9 million compared to 2011, primarily due to higher revenues largely from higher net investment
income related to the receipt of mortgage loan and bond prepayment fees and other investments, which more than
offset the pressure on yields from the current low interest rate environment.
Our group benefit ratios, which represent current and future benefits divided by premiums, were 93.5% for 2013,
88.3% for 2012, and 87.5% for 2011. The increase in our group benefit ratio in 2013 is primarily due to the fourth
quarter 2013 charge related to changes in our life insurance claim payment practices (including related escheatment
practices) and lower underwriting margins in our group life insurance products from higher claim incidence,
partially offset by higher underwriting margins in our disability products.
LARGE CASE PENSIONS
Large Case Pensions manages a variety of retirement products (including pension and annuity products) primarily
for tax-qualified pension plans. These products provide a variety of funding and benefit payment distribution
options and other services. The Large Case Pensions segment includes certain discontinued products.
Operating Summary
(Millions) 2013 2012 2011
Premiums $ 140.0 $ 165.7 $ 161.0
Group annuity contract conversion premium (1) 99.0 941.4 —
Net investment income 320.4 329.0 327.8
Other revenue 9.6 10.9 11.0
Net realized capital (losses) gains (12.8) (.5) 1.6
Total revenue 556.2 1,446.5 501.4
Current and future benefits 440.2 477.5 464.3
Benefit expense on group annuity contract conversion (1) 99.0 941.4 —
General and administrative expenses 12.4 12.6 14.3
Reduction of reserve for anticipated future losses on discontinued products (86.0) — —
Total benefits and expenses 465.6 1,431.5 478.6
Income before income taxes 90.6 15.0 22.8
Income taxes (benefits) 21.8 (2.4) 1.0
Net income attributable to Aetna $ 68.8 $ 17.4 $ 21.8
(1) In 2013 and 2012, pursuant to contractual rights exercised by contract holders, certain existing group annuity contracts were converted
from participating to non-participating contracts. Upon conversion, we recorded $99.0 million and $941.4 million of non-cash group
annuity conversion premium for these contracts and a corresponding $99.0 million and $941.4 million non-cash benefit expense on
group annuity conversion for these contracts during 2013 and 2012, respectively.