Aetna 2013 Annual Report Download - page 16
Download and view the complete annual report
Please find page 16 of the 2013 Aetna annual report below. You can navigate through the pages in the report by either clicking on the pages listed below, or by using the keyword search tool below to find specific information within the annual report.-
 1
1 -
2
-
3
-
4
-
5
-
 6
6 -
 7
7 -
 8
8 -
 9
9 -
 10
10 -
 11
11 -
 12
12 -
 13
13 -
 14
14 -
 15
15 -
 16
16 -
 17
17 -
 18
18 -
 19
19 -
 20
20 -
 21
21 -
 22
22 -
 23
23 -
 24
24 -
 25
25 -
 26
26 -
27
-
28
-
29
-
30
-
31
-
32
-
33
-
34
-
35
-
36
-
37
-
38
-
39
-
40
-
41
-
42
-
43
-
44
-
45
-
46
-
47
-
48
-
49
-
50
-
51
-
52
-
53
-
54
-
55
-
56
-
57
-
58
-
59
-
60
-
61
-
62
-
63
-
64
-
65
-
66
-
67
-
68
-
69
-
70
-
71
-
72
-
73
-
74
-
75
-
76
-
77
-
78
-
79
-
80
-
81
-
82
-
83
-
84
-
85
-
86
-
87
-
88
-
89
-
90
-
91
-
92
-
93
-
94
-
95
-
96
-
97
-
98
-
99
-
100
-
101
-
102
-
103
-
104
-
105
-
106
-
107
-
108
-
109
-
110
-
111
-
112
-
113
-
114
-
115
-
116
-
117
-
118
-
119
-
120
-
121
-
122
-
123
-
124
-
125
-
126
-
127
-
128
-
129
-
130
-
131
-
132
-
133
-
134
-
135
-
136
-
137
-
138
-
139
-
140
-
141
-
142
-
143
-
144
-
145
-
146
-
147
-
148
-
149
-
150
-
151
-
152
-
153
-
154
-
155
-
156
 |
 |
Annual Report- Page 10
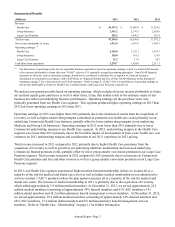
Our Medicare MBRs were 88.1%, 83.8% and 84.0% for 2013, 2012 and 2011, respectively. The increase in our
Medicare MBR in 2013 is primarily due to favorable 2012 experience being reflected in establishing customer
premiums upon renewal in 2013 as well as underperformance in two specific Medicare product offerings and the
impacts of sequestration on Medicare reimbursement rates. Our Medicare MBR declined slightly in 2012 compared
to 2011 as an increase in the proportion of Medicare Supplement business, which has a lower MBR, was mostly
offset by more competitive pricing intended to drive improved sales.
Medicaid operating results for 2013 primarily reflected an increase in membership from the Coventry
acquisition.
Medicaid premiums increased approximately $2.2 billion in 2013 compared to 2012 due primarily to the addition of
Coventry membership as well as the favorable impact of in-state expansions and growth in high acuity populations
in our underlying business, partially offset by lower premiums as a result of the sale of our Missouri Medicaid
business on March 31, 2013. Medicaid premiums increased approximately $237 million in 2012 compared to 2011
as a result of our in-state expansions, including membership increases in certain high acuity Medicaid contracts
with greater per-member premium rates, primarily in Delaware and Illinois, and from our expanded presence in
Missouri. These increases more than offset the decline in premium from other membership losses in 2012.
Our Medicaid MBRs were 85.6%, 89.0% and 87.3% for 2013, 2012 and 2011, respectively. The improvement in
our 2013 Medicaid MBR compared to 2012 is primarily due to the inclusion of Coventry, which added geographies
carrying relatively lower MBRs as well as an increase in favorable development of prior years' health care cost
estimates. The increase in our Medicaid MBR in 2012 was primarily a result of higher MBRs in select geographies
as well as the termination of a contract in 2011 that carried a relatively lower MBR.
Fees and Other Revenue
Health Care fees and other revenue for 2013 increased $689 million compared to 2012 due primarily to the
inclusion of Coventry's service businesses. Health Care fees and other revenue for 2012 increased $132 million
compared to 2011 primarily as a result of the full-year impact of the revenues from our 2011 acquisitions.
General and Administrative Expenses
General and administrative expenses increased by approximately $1.6 billion during 2013 compared to 2012 due
primarily to the inclusion of Coventry's general and administrative expenses as well as transaction, integration-
related and restructuring costs and growth in our underlying business which were partially offset by continued
execution of our expense reduction initiatives, including execution on our Coventry-related cost synergies. General
and administrative expenses increased $76 million during 2012 compared to 2011 due primarily to the full year
impact of operating expenses associated with our 2011 acquisitions and incremental investment spending on growth
initiatives partially offset by continued execution of our expense reduction initiatives.