Aetna 2013 Annual Report Download - page 15
Download and view the complete annual report
Please find page 15 of the 2013 Aetna annual report below. You can navigate through the pages in the report by either clicking on the pages listed below, or by using the keyword search tool below to find specific information within the annual report.-
 1
1 -
2
-
3
-
4
-
 5
5 -
 6
6 -
 7
7 -
 8
8 -
 9
9 -
 10
10 -
 11
11 -
 12
12 -
 13
13 -
 14
14 -
 15
15 -
 16
16 -
 17
17 -
 18
18 -
 19
19 -
 20
20 -
 21
21 -
 22
22 -
 23
23 -
 24
24 -
 25
25 -
26
-
27
-
28
-
29
-
30
-
31
-
32
-
33
-
34
-
35
-
36
-
37
-
38
-
39
-
40
-
41
-
42
-
43
-
44
-
45
-
46
-
47
-
48
-
49
-
50
-
51
-
52
-
53
-
54
-
55
-
56
-
57
-
58
-
59
-
60
-
61
-
62
-
63
-
64
-
65
-
66
-
67
-
68
-
69
-
70
-
71
-
72
-
73
-
74
-
75
-
76
-
77
-
78
-
79
-
80
-
81
-
82
-
83
-
84
-
85
-
86
-
87
-
88
-
89
-
90
-
91
-
92
-
93
-
94
-
95
-
96
-
97
-
98
-
99
-
100
-
101
-
102
-
103
-
104
-
105
-
106
-
107
-
108
-
109
-
110
-
111
-
112
-
113
-
114
-
115
-
116
-
117
-
118
-
119
-
120
-
121
-
122
-
123
-
124
-
125
-
126
-
127
-
128
-
129
-
130
-
131
-
132
-
133
-
134
-
135
-
136
-
137
-
138
-
139
-
140
-
141
-
142
-
143
-
144
-
145
-
146
-
147
-
148
-
149
-
150
-
151
-
152
-
153
-
154
-
155
-
156
 |
 |

Annual Report- Page 9
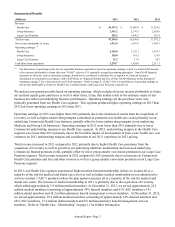
Operating earnings in 2013 increased compared to 2012.
In 2013, operating earnings increased compared to the corresponding period in 2012, primarily due to the
acquisition of Coventry in May 2013, as well as higher underwriting margins primarily in our underlying
Commercial business, partially offset by lower operating margins in our underlying Medicare business. 2012
operating earnings were lower than 2011, primarily due to lower Commercial underwriting margins which declined
primarily due to the favorable impact of development of prior-years' health care cost estimates on 2011 Commercial
underwriting margins and consideration of our 2011 experience in our 2012 pricing, partially offset by higher
underwriting margins in our Medicare business, primarily the result of the full-year impact of Genworth's Medicare
Supplement business, which we acquired in October 2011. Refer to our discussion of Commercial and Medicare
results below for additional information.
We calculate our medical benefit ratio (“MBR”) by dividing health care costs by premiums. Our MBRs by product
for the last three years were:
2013 2012 2011
Commercial 80.1% 81.1% 77.9%
Medicare 88.1% 83.8% 84.0%
Medicaid 85.6% 89.0% 87.3%
Government (1) 87.5% 84.9% 84.7%
Total 82.9% 82.2% 79.6%
(1) Our Government MBR is the combined MBR of our Medicare and Medicaid businesses.
Refer to our discussion of Commercial, Medicare and Medicaid results below for an explanation of the changes in
our MBRs.
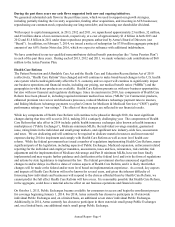
Commercial operating results for 2013 reflected an increase in membership from the Coventry acquisition.
Commercial premiums were $3.5 billion higher in 2013 than 2012, primarily from the acquisition of Coventry and
higher premium rates in our underlying Commercial Insured business. Commercial premiums were $681 million
higher in 2012 than 2011, primarily due to higher Commercial premium rates partially offset by lower Commercial
Insured membership in 2012.
Our Commercial MBRs were 80.1%, 81.1% and 77.9% for 2013, 2012 and 2011, respectively. The improvement in
our Commercial MBR in 2013 compared to 2012 is primarily due to the impact of increased favorable development
of prior-years’ health care cost estimates in 2013. The increase in our Commercial MBR in 2012 compared to 2011
is primarily due to the favorable impact of development of prior-years' health care cost estimates on the 2011 MBR
and consideration of our 2011 experience in 2012 pricing. The majority of the development in 2011 resulted from
lower than projected paid claims in the first half of 2011 for claims incurred in the latter half of 2010 caused by
lower than projected utilization of medical services (“utilization”).
The calculation of Health Care Costs Payable is a critical accounting estimate (refer to “Critical Accounting
Estimates - Health Care Costs Payable” beginning on page 23 for additional information).
Medicare operating results for 2013 reflected an increase in membership, primarily from the Coventry
acquisition, offset by lower underwriting margins in our underlying business.
Medicare premiums increased approximately $5.1 billion in 2013 compared to 2012 and increased approximately
$766 million in 2012 compared to 2011. The increase in 2013 is primarily due to the addition of Coventry
membership as well as membership growth in our underlying business. The 2012 increase is primarily due to
membership growth in our Medicare Advantage products and the full-year impact of the addition of Genworth's
Medicare Supplement business, which we acquired in October 2011.