Advance Auto Parts 2002 Annual Report Download - page 2
Download and view the complete annual report
Please find page 2 of the 2002 Advance Auto Parts annual report below. You can navigate through the pages in the report by either clicking on the pages listed below, or by using the keyword search tool below to find specific information within the annual report.-
 1
1 -
 2
2 -
 3
3 -
 4
4 -
 5
5 -
 6
6 -
 7
7 -
 8
8
 |
 |
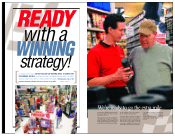
We’re ready with quality parts at value prices. We’re
ready with friendly Team Members who know their
stuff. We’re ready with clean, conveniently located
stores.
We’re ready in Advance. Advance Auto Parts offers one
of the largest selections of brand name and private
label auto parts, accessories, and maintenance items in
the automotive aftermarket. More than 120,000 items
in all.
But it isn’t enough to have the right products. We have to
provide customers great value. Our recent category man-
agement initiatives are optimizing our pricing, increasing
our product selection, improving our merchandising, and
enhancing our inventory productivity.
We’re ready in Advance. Our entire team is focused on our
customers’ needs. “Ring, ring” is our way of reminding
Team Members to answer all calls within three rings. And
a customer has to be greeted within 10 feet of entering our
store for us to earn a “Perfect 10.”
Once we make our customers feel welcome, we focus on
solving their problem. Trained Team Members ask the
right questions and give sound advice. They’re also eager to
test batteries, starters, alternators, sensors, and ignition
modules. Whatever the customers’ problem, we have a
solution. No wonder they keep coming back.
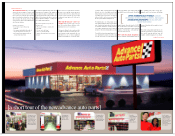
We now have more than 2,400 attractive locations in 37
states. During 2002, we opened 110 new stores. And we
also relocated 39 to more convenient sites in existing mar-
kets. Because it’s more important to us to be a neighbor-
hood store than a national one. That’s why we’re always
improving our stores, making them brighter, and more
inviting. We’ve always attracted the smart DIYers; now
current initiatives include educating more customers to
help them maintain a safe fuel-efficient vehicle.
But what really sets us apart is that we’re a big company
with small town values. Founded in 1929, Advance Auto
Parts is built on honesty and integrity. Our team members
care about their communities, proved by the $8 million
we’ve raised, with the help of our customers, for the
Juvenile Diabetes Research Foundation since 1995. But
they also care about their customers. And about each
other. We’re ready to take the next step to an even higher
level of success!
23
In 2002, more than 190 million
customers chose Advance Auto Parts
for their automotive needs. Proof that
when customers come through our doors,
we have what it takes to win them over –
and keep them coming back.
We’re
ready
with a
winning
team!
We’re ready.
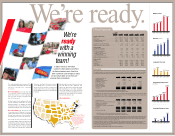
5 Year Financials
5-Year
Compounded
Growth 2002 2001 2000 1999 1998
(in thousands, except per share data)
Statement of Operations Data:
Net sales……………………………………………………...28.1% $ 3,287,883 $ 2,517,639 $ 2,288,022 $2,206,945 $ 1,220,759
Gross profit (1) ……………………………………………… 33.6% 1,447,994 1,076,026 895,895 802,832 454,561
Comparable operating income (2) ……………………………39.8% 237,517 123,770 94,374 62,351 62,208
Comparable net income (3)…………………………………...56.5% $ 97,138 $ 38,088 $ 17,596 $ 154 $ 16,197
Comparable net income per diluted share (3)…………………. $ 2.68 $ 1.31 $ 0.62 $ 0.01 $ 0.87
Weighted average diluted shares outstanding…………………. 36,188 29,158 28,611 28,269 18,606
Selected Store Data:
Comparable store sales growth ………………………………. 5.5% 6.2% 4.4% 10.3% 7.8%
Number of stores, end of period………………………………. 2,435 2,484 1,729 1,617 1,567
Stores with commercial delivery
program, end of period …………………………………… 1,411 1,370 1,210 1,094 532
Total retail store square footage, end
of period (in thousands) …………………………………... 18,108 18,717 13,325 12,476 12,084
Average net retail sales per store (4) …………………………. $ 1,303 $ 1,346 $ 1,295 $ 1,267 $ 1,270
Average net retail sales per square foot (5)…………………… $ 174 $ 175 $ 168 $ 164 $ 172
Balance Sheet Data:
Inventory……………………………………………………… $1,048,803 $ 982,000 $ 788,914 $ 749,447 $ 726,172
Net working capital …………………………………………… 462,896 442,099 318,583 355,608 310,113
Total assets……………………………………………………. 1,965,225 1,950,615 1,356,360 1,348,629 1,265,355
Total net debt (6) ……………………………………………… 722,506 972,368 582,539 627,467 485,476
Total stockholders' equity …………………………………….. 468,356 288,571 156,271 133,954 159,091
(1) Gross profit for fiscal 2001 excludes the non-recurring charge of $9,099 associated with our supply chain initiatives recorded in the fourth quarter.
(2) Comparable operating income excludes certain non-recurring charges as included in the following reconciliation of this measurement to our operating
income presented under generally accepted accounting policies in our financial statements included in the accompanying annual report on form 10-K.
2002 2001(a) 2000 1999 1998
Comparable operating income $ 237,517 $ 123,770 $ 94,374 $ 62,351 $ 62,208
Supply chain initiatives - (10,492) - - -
Impairment of assets held for sale - (10,700) (856) - -
Recapitalization expenses - - - - (14,277)
Merger related restructuring (597) (3,719) - - (6,774)
Merger and integration (34,935) (1,135) - (41,034) (7,788)
Private company expenses - - - - (845)
Stock option compensation - (8,611) (729) (1,082) (695)
Operating income $ 201,985 $ 89,113 $ 92,789 $ 20,235 $ 31,829
(a) Fiscal 2001 excludes only the non-recurring charges taken during the fourth quarter.
For more information see the fiscal 2001 financial statements and accompanying footnotes.
(3) Comparable net income excludes the nonrecurring items in footnote (1) and (2) above and the extraordinary items and cumulative effect of a change
in accounting principle. The following is a reconciliation of comparable net income to net income presented under generally accepted accounting policies in
our financial statements included in the accompanying annual report on form 10-K.
2002 2001(a) 2000 1999 1998
Comparable net income $ 97,138 $ 38,088 $ 17,596 $ 154 $ 16,197
Add back non-recurring items from footnote (1) and (2) (35,532) (34,657) (1,585) (42,116) (30,379)
Tax impact of non-recurring items 13,786 13,758 615 16,636 12,000
Extraordinary items, net of tax (10,373) (3,682) 2,933 - -
Cumulative effect of a change in accounting principle,
net of tax - (2,065) - - -
Net income $ 65,019 $ 11,442 $ 19,559 $ (25,326) $ (2,182)
Net income per diluted share $ 1.80 $ 0.39 $ 0.68 $ (0.90) $ (0.12)
(a) Fiscal 2001 excludes only the non-recurring charges taken during the fourth quarter.
For more information see the fiscal 2001 financial statements and accompanying footnotes.
(4) Average net retail sales per store is calculated as net sales of the retail segment divided by the average of the beginning and ending number of stores
for the respective period. The 1998 amounts were calculated giving effect to the Parts America net retail sales and the number of stores for the period
from November 1, 1998 through January 2, 1999. The 2001 amounts were calculated giving effect to the Discount net retail sales and the number of
stores for the period from December 2, 2001 through December 29, 2001.
(5) Average net retail sales per square foot is calculated as net sales of the retail segment divided by the average of the beginning and ending square footage
for the respective period. The 1998 amounts were calculated giving effect to the Parts America net retail sales and square footage for the period from
November 1, 1998 through January 2, 1999. The 2001 amounts were calculated giving effect to the Discount net retail sales and square footage for the period
from December 2, 2001 through December 29, 2001.
(6) Net debt includes total debt and bank overdrafts, less cash and cash equivalents.
1998 1999 2000
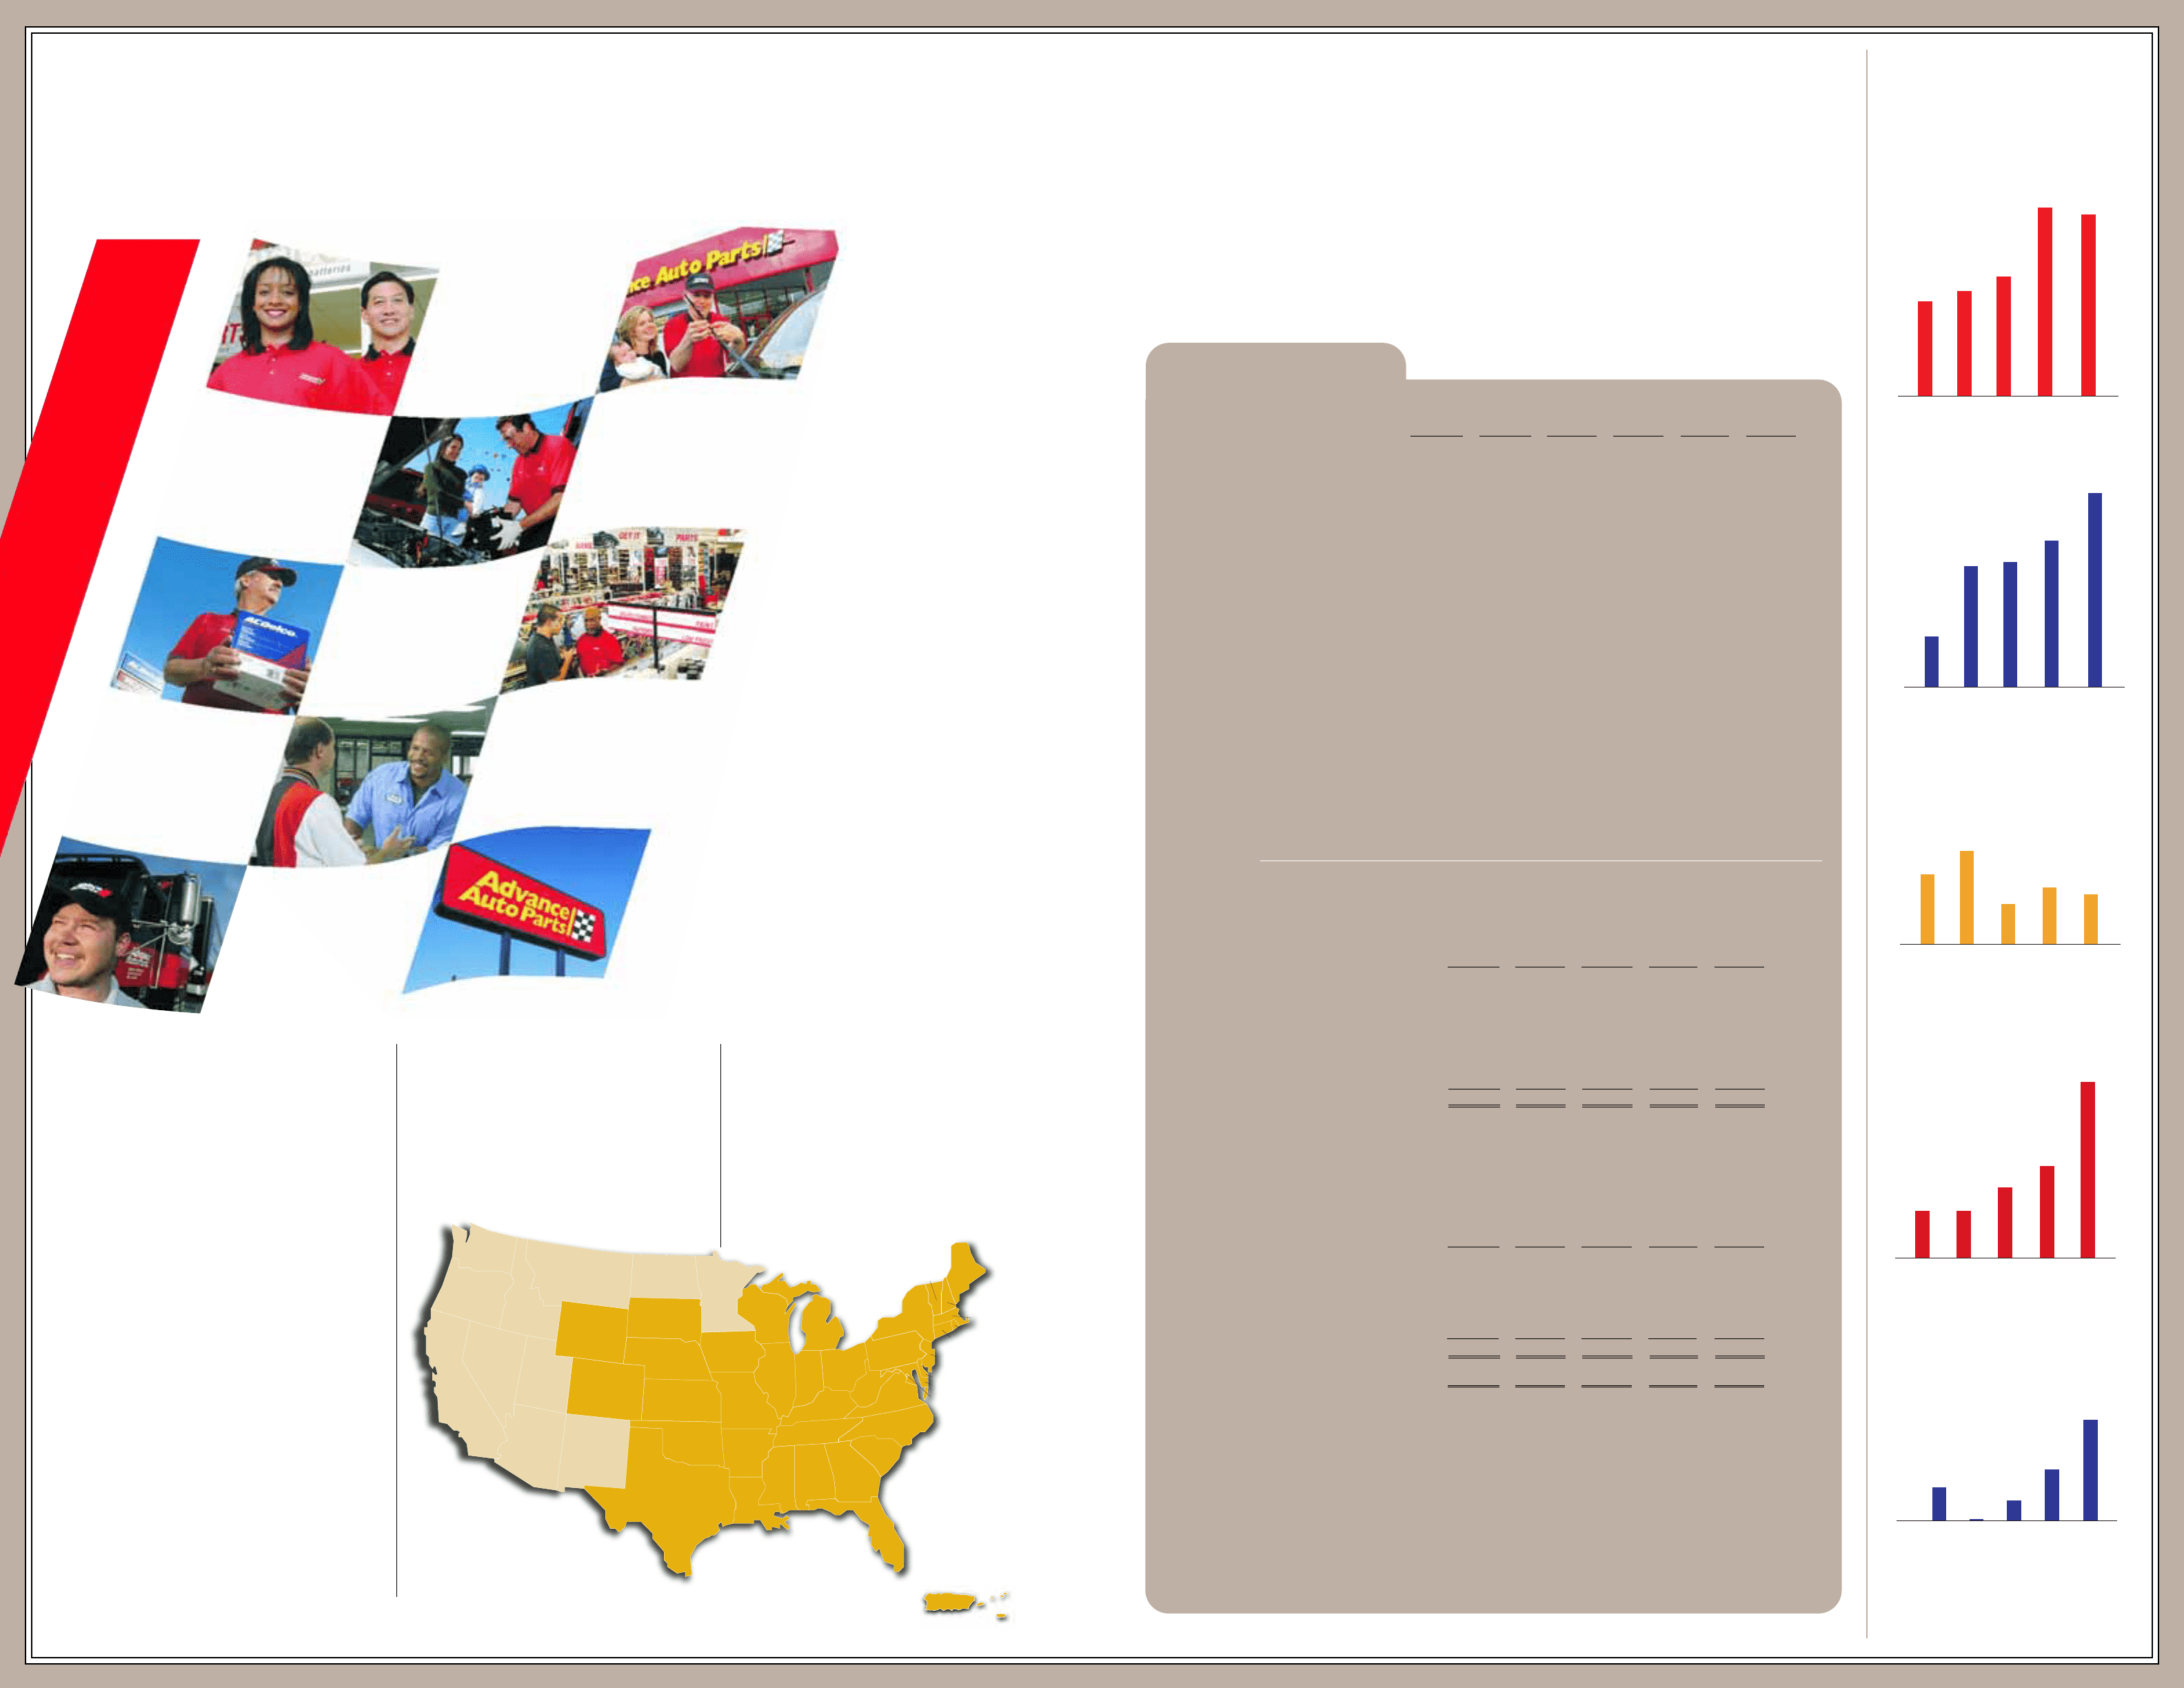
2,435
2,484
1,729
1,617
1,5 67
2001
Number of Stores
2002
1998 1999 2000
$3.3
$2.5
$2.3
$2.2
$1.2
2001
Sales
(in billions)
2002
1998 1999 2000
5.5%
6.2%
4.4%
10.3%
7.8%
2001 2002
Comparable Store SalesComparable Store Sales
1998 1999 2000 2001
Comparable Earnings Per Share
2002
$1.31
.87
.01
.62
$2.68
Number of Stores
Net Sales (in billions)
Comparable Store Sales
Comparable Earnings per Share
Connecticut
23
New Jersey
22
Delaware
5
Maryland
60
Michigan
49
Missouri
35
Nebraska
17
Rhode Island
3
Massachusetts
2
1
Maine
7
New Hampshire
4
Vermont
3
New York
98
Pennsylvania
135
West
Virginia
63
Ohio
145
Kentucky
66
Virginia
150
North Carolina
179
South Carolina
103
Georgia
191
Alabama
104
Arkansas
21
Texas
54
Colorado
15
Florida
430
Puerto Rico
34
Virgin Islands
2
Illinois
23
Iowa
24
Louisiana
58
Indiana
71
Kansas
26
Oklahoma
1
South Dakota
6
Wisconsin
18
Wyoming
2
California
1
Mississippi
47
Tennessee
118
Washington, DC
1
We’re ready with quality parts at value prices. We’re
ready with friendly Team Members who know their
stuff. We’re ready with clean, conveniently
located stores.
We’re ready in Advance. Advance Auto Parts offers
one of the largest selections of brand name and
private label auto parts, accessories, and mainte-
nance items in the automotive aftermarket. More
than 120,000 items in all.
But it isn’t enough to have the right products. We have
to provide customers great value. Our recent category
management initiatives are optimizing our pricing,
increasing our product selection, improving our mer-
chandising, and enhancing our inventory productivity.
We’re ready in Advance. Our entire team is focused
on our customers’ needs. “Ring, ring” is our way of
reminding Team Members to answer all calls within
three rings. And a customer has to be greeted within 10
feet of entering our store for us to earn a “Perfect 10.”
Once we make our customers feel welcome, we focus
on solving their problem. Trained Team Members ask
the right questions and give sound advice. They’re also
eager to test batteries, starters, alternators, sensors, and
ignition modules. Whatever the customers’ problem,
we have a solution. No wonder they keep coming back.
We now have more than 2,400 attractive locations in
37 states. During 2002, we opened 110 new stores.
And we also relocated 39 to more convenient sites in
existing markets. We keep our stores looking great
with our GOLD standard, having a “Grand Opening
Look Daily.”
But what really sets us apart is that we’re a big com-
pany with small town values. Founded in 1929,
Advance Auto Parts is built on honesty and integrity.
Our Team Members care about their communities,
proved by the $8 million we’ve raised, with the help
of our customers, for the Juvenile Diabetes Research
Foundation since 1995. But they also care about their
customers. And about each other.
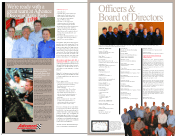
We’re ready in Advance.
Advance Auto Parts, Inc. is
based in Roanoke, Virginia and
is the second largest auto parts
retailer in the United States. At
December 28, 2002, the Company
had 2,435 stores in 37 states, Puerto
Rico, and the Virgin Islands. The
Company serves both the do-it-
yourself and professional
installer markets.
Puerto Rico 34
Virgin Islands 2
California 1
1998 1999 2000 2001
Comparable Operations Income
(in millions)
2002
$62,208 $62,351
$94,374
$123,770
$237,517
Comparable Operating Income
(in millions)
Footnotes
$62.2 $62.4
$94.4
$123.8
$237.5
$.87
$.01 $.62