iHeartMedia 2005 Annual Report Download - page 9
Download and view the complete annual report
Please find page 9 of the 2005 iHeartMedia annual report below. You can navigate through the pages in the report by either clicking on the pages listed below, or by using the keyword search tool below to find specific information within the annual report.-
 1
1 -
 2
2 -
 3
3 -
 4
4 -
 5
5 -
 6
6 -
 7
7 -
 8
8 -
 9
9 -
 10
10 -
 11
11 -
 12
12 -
 13
13 -
 14
14 -
 15
15 -
 16
16 -
 17
17 -
 18
18 -
 19
19 -
 20
20 -
21
-
22
-
23
-
24
-
25
-
26
-
27
-
28
-
29
-
30
-
31
-
32
-
33
-
34
-
35
-
36
-
37
-
38
-
39
-
40
-
41
-
42
-
43
-
44
-
45
-
46
-
47
-
48
-
49
-
50
-
51
-
52
-
53
-
54
-
55
-
56
-
57
-
58
-
59
-
60
-
61
-
62
-
63
-
64
-
65
-
66
-
67
-
68
-
69
-
70
-
71
-
72
-
73
-
74
-
75
-
76
-
77
-
78
-
79
-
80
-
81
-
82
-
83
-
84
-
85
-
86
-
87
-
88
-
89
-
90
-
91
-
92
-
93
-
94
-
95
-
96
-
97
-
98
-
99
-
100
-
101
-
102
-
103
-
104
-
105
-
106
-
107
-
108
-
109
-
110
-
111
-
112
-
113
-
114
-
115
-
116
-
117
-
118
-
119
-
120
-
121
 |
 |

9
Other Inventory
The balance of our display inventory consists of spectaculars, mall displays and wallscapes. Spectaculars are
customized display structures that often incorporate video, multidimensional lettering and figures, mechanical devices
and moving parts and other embellishments to create special effects. The majority of our spectaculars are located in
Dundas Square in Toronto, Times Square and Penn Plaza in New York City, Fashion Show in Las Vegas, Sunset Strip
in Los Angeles and across from the Target Center in Minneapolis. Client contracts for spectaculars typically have terms
of one year or longer. We also own displays located within the common areas of malls on which our clients run
advertising campaigns for periods ranging from four weeks to one year. Contracts with mall operators grant us the
exclusive right to place our displays within the common areas and sell advertising on those displays. Our contracts with
mall operators generally have terms ranging from five to ten years. Client contracts for mall displays typically have
terms ranging from six to eight weeks. A wallscape is a display that drapes over or is suspended from the sides of
buildings or other structures. Generally, wallscapes are located in high-profile areas where other types of outdoor
advertising displays are limited or unavailable. Clients typically contract for individual wallscapes for extended terms.
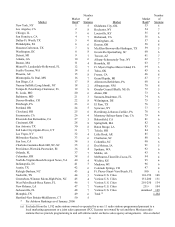
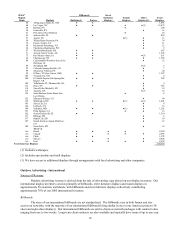
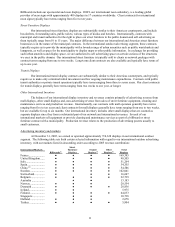
Advertising inventory and markets
At December 31, 2005, we owned or operated approximately 164,634 displays in our Americas outdoor
segment. The following table sets forth certain selected information with regard to our Americas outdoor advertising
inventory, with our markets listed in order of their DMA® region ranking (DMA® is a registered trademark of Nielson
Media Research, Inc.):
DMA® Billboards Street
Region Furniture Transit Other Total
Rank Markets Bulletins(1) Posters Displays Displays Displays(2) Displays
United States
1 New York, NY ● ● ● ● ● 18,614
2 Los Angeles, CA ● ● ● ● ● 11,729
3 Chicago, IL ● ● ●(3) ● 11,612
4 Philadelphia, PA ● ● ● ● ● 5,408
5 Boston, MA (Manchester, NH) ● ● ● ● 6,893
6 San Francisco-Oakland-San Jose,
CA
● ● ● ● ● 6,671
7 Dallas-Ft. Worth, TX ● ● ● ● 6,906
8 Washington, DC (Hagerstown,
MD)
● ● ● ● ● 3,775
9 Atlanta, GA ● ● ● ● 3,284
10 Houston, TX ● ● ●(3) ● 4,717
11 Detroit, MI ● ● 539
12 Tampa-St. Petersburg (Sarasota),
FL
● ● ● 1,953
13 Seattle-Tacoma, WA ● ● ● ● 3,293
14 Phoenix (Prescott), AZ ● ● ●(3) 1,465
15 Minneapolis-St. Paul, MN ● ● ● ● 1,978
16 Cleveland-Akron (Canton), OH ● ● ● ● 2,445
17 Miami-Ft. Lauderdale, FL ● ● ● ● ●(3) 3,614
18 Denver, CO ● ● 824
19 Sacramento-Stockton-Modesto, CA ● ● ● ● 950
20 Orlando-Daytona Beach-
Melbourne, FL
● ● ● ● 3,431
21 St. Louis, MO ● ● 234
22 Pittsburgh, PA ● ●(3) ● 546
23 Portland, OR ● ● ● 1,269
24 Baltimore, MD ● ● ● ●(3) 2,011
25 Indianapolis, IN ● ● ● 1,978
26 San Diego, CA ● ● ● ●(3) 1,323
27 Charlotte, NC ● 12
28 Hartford-New Haven, CT ● ● 10
29 Raleigh-Durham (Fayetteville), NC ● 11
30 Nashville, TN ● 21
31 Kansas City, KS/MO ●(3) —
32 Columbus, OH ● ● ● 1,401
33 Milwaukee, WI ● ● ● ● 1,689
34 Cincinnati, OH ● 8
36 Salt Lake City, UT ● ● 124
37 San Antonio, TX ● ● ●(3) ●(3) 3,006
38 West Palm Beach-Ft. Pierce, FL ● ● ● 377
41 Harrisburg-Lancaster-Lebanon-
York, PA
● 31
42 Norfolk-Portsmouth-Newport
News, VA
● 11
43 New Orleans, LA ● 2,775
44 Memphis, TN ● ● ● ● 2,220
45 Oklahoma City, OK ● 12