Yamaha 2009 Annual Report Download - page 3
Download and view the complete annual report
Please find page 3 of the 2009 Yamaha annual report below. You can navigate through the pages in the report by either clicking on the pages listed below, or by using the keyword search tool below to find specific information within the annual report.-
 1
1 -
 2
2 -
 3
3 -
 4
4 -
 5
5 -
 6
6 -
 7
7 -
 8
8 -
 9
9 -
 10
10 -
 11
11 -
 12
12 -
 13
13 -
 14
14 -
15
-
16
-
17
-
18
-
19
-
20
-
21
-
22
-
23
-
24
-
25
-
26
-
27
-
28
-
29
-
30
-
31
-
32
-
33
-
34
-
35
-
36
-
37
-
38
-
39
-
40
-
41
-
42
-
43
-
44
-
45
-
46
-
47
-
48
-
49
-
50
-
51
-
52
-
53
-
54
-
55
-
56
-
57
-
58
-
59
-
60
-
61
-
62
-
63
-
64
-
65
-
66
-
67
-
68
-
69
-
70
-
71
-
72
-
73
-
74
-
75
-
76
-
77
-
78
-
79
-
80
-
81
-
82
-
83
-
84
 |
 |

600,000
05/3 06/3 07/3 08/3 09/3
400,000
200,000
0
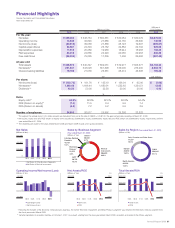
Financial Highlights
Yamaha Corporation and Consolidated Subsidiaries
Years ended March 31
Millions of Yen
Millions of
U.S. Dollars*
2009 2008 2007 2006 2005 2009
For the year:
Net sales ¥ 459,284 ¥ 548,754 ¥ 550,361 ¥ 534,084 ¥ 534,079 $4,675.60
Operating income 13,845 32,845 27,685 24,135 35,695 140.95
Net income (loss) (20,615) 39,558 27,866 28,123 19,697 (209.87)
Capital expenditures 22,581 24,394 25,152 22,882 22,702 229.88
Depreciation expenses 17,912 20,289 19,956 18,944 18,958 182.35
R&D expenses 23,218 24,865 24,220 24,055 22,953 236.36
Free cash flows (28,234) 79,225 17,305 7,406 26,692 (287.43)
At year-end:
Total assets ¥ 408,974 ¥ 540,347 ¥ 559,031 ¥ 519,977 ¥ 505,577 $4,163.43
Net assets** 251,841 343,028 351,398 316,005 275,200 2,563.79
Interest-bearing liabilities 19,192 21,036 25,551 28,474 46,598 195.38
Yen U.S. Dollars
Per share:
Net income (loss) ¥ (103.73) ¥ 191.76 ¥ 135.19 ¥ 136.04 ¥ 95.06 $ (1.06)
Net assets** 1,262.42 1,646.44 1,680.91 1,532.62 1,334.51 12.85
Dividends*** 42.50 50.00 22.50 20.00 20.00 0.43
%
Ratio:
Equity ratio** 60.9% 62.9% 62.0% 60.8% 54.4%
ROE (Return on equity)** (7.0) 11.5 8.4 9.5 7.4
ROA (Return on assets) (4.3) 7.2 5.2 5.5 3.9
Number of employees 26,803 26,517 25,992 25,298 23,828
* Throughout this annual report, U.S. dollar amounts are translated from yen at the rate of ¥98.23 = U.S.$1.00, the approximate rate prevailing on March 31, 2009.
** Net assets, equity ratio and ROE (return on equity) were classified as shareholders’ equity, shareholders’ equity ratio and ROE (return on shareholders’ equity), respectively, until the
year ended March 31, 2006.
*** The dividends per share for the years ended March 2008 and March 2009 include a ¥20 special dividend.
Net Sales
(Millions of Yen)
n Net Sales of Other Business Segments
n Net Sales of Musical Instruments
* Following the transfer of the electronic metal products business, the former Electronic Equipment and Metal Products segment was renamed the Electronic Devices segment from
the fiscal year ended March 2009.
** Yamaha transferred 4 recreation facilities on October 1, 2007. As a result, starting from the fiscal year ended March 2009, recreation is included in the Others segment.
Sales by Business Segment
(Year ended March 31, 2009)
(Millions of Yen)
Sales by Region (Year ended March 31, 2009)
(Millions of Yen)
Electronic
Devices*
21,975
4.8%
Europe
86,810
18.9%
Lifestyle-Related
Products
43,121
9.4%
Others**
30,833
6.7%
Asia, Oceania and Other Areas
71,237
15.5%
Musical
Instruments
306,630
66.8%
Japan
234,844
51.1%
AV/IT
56,722
12.3% North America
66,392
14.5%
400,000
05/3 06/3 07/3 08/3 09/3
200,000
0
20.0
10.0
0
–10.0
Net Assets/ROE
(Millions of Yen) (%)
n Net Assets
–
ROE
50,000
05/3 06/3 07/3 08/3 09/3
25,000
0
–25,000
Operating Income/Net Income (Loss)
(Millions of Yen)
n Operating Income
n Net Income (Loss)
600,000
05/3 06/3 07/3 08/3 09/3
300,000
0
10.0
5.0
0
–5.0
Total Assets/ROA
(Millions of Yen) (%)
n Total Assets
–
ROA
Annual Report 2009 01