Yamaha 2003 Annual Report Download - page 11
Download and view the complete annual report
Please find page 11 of the 2003 Yamaha annual report below. You can navigate through the pages in the report by either clicking on the pages listed below, or by using the keyword search tool below to find specific information within the annual report.-
 1
1 -
 2
2 -
 3
3 -
 4
4 -
 5
5 -
 6
6 -
 7
7 -
 8
8 -
 9
9 -
 10
10 -
 11
11 -
 12
12 -
 13
13 -
 14
14 -
 15
15 -
 16
16 -
 17
17 -
 18
18 -
 19
19 -
 20
20 -
 21
21 -
 22
22 -
23
-
24
-
25
-
26
-
27
-
28
-
29
-
30
-
31
-
32
-
33
-
34
-
35
-
36
-
37
-
38
-
39
-
40
-
41
-
42
-
43
-
44
-
45
-
46
-
47
-
48
-
49
-
50
 |
 |

ANNUAL REPORT 2003 9
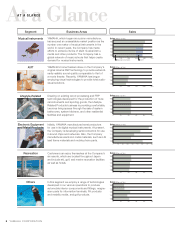
•Pianos
(upright pianos, grand pianos, etc.)
•Digital musical instruments
(Clavinovas™, Electones™, portable
keyboards, synthesizers)
•Wind instruments
(trumpets, flutes, saxophones, etc.)
•String instruments
(guitars, violins)
•Percussion instruments
(drums, vibraphones, etc.)
•Educational musical instruments
(recorders, Pianicas™, etc.)
•Professional audio equipment
(digital mixers, powered speakers)
•Soundproof rooms: Avitecs™
•Music schools, English schools
•Ringing melody distribution service
•Audio products
(AV amplifiers and receivers, speaker
systems, on-line karaoke, etc.)
•Visual products
(digital cinema projectors)
•Routers
•System bathrooms, system kitchens,
washstands, parts for housing facili-
ties, wooden doors
•Semiconductors
(sound chips, etc.)
•Specialty metals
(lead frame materials, mobile
phone parts)
•Sightseeing facilities and
accommodation facilities
(Tsumagoi, Nemunosato,
Haimurubushi, Kiroro,
Toba-Kokusai, Kitanomaru)
•Ski resort
(Kiroro ski resort)
•Golf courses
(Katsuragi Golf Club,
Nemunosato Golf Club)
•Golf products
•Automobile interior components
and fittings
•Industrial robots
•Molds and magnesium parts
0510 15 20 25 30 35
Musical Instruments AV/IT
’03
’02
’01
’00
’99
Operating Income
(Billions of Yen)
0.0 2.5 5.0 7.5 10.0 12.5 15.0 17.5
’03
’02
’01
’00
’99
Operating Income
(Billions of Yen)
-3 -2 -1 0 12
’03
’02
’01
’00
’99
Operating Income (Loss)
(Billions of Yen)
-30 -20 -10 0 10 20
’03
’02
’01
’00
’99
Operating Income (Loss)
(Billions of Yen)
-3 -2 -1 0 12
’03
’02
’01
’00
’99
Operating Loss
(Billions of Yen)
-3 -2 -1 0 12
’03
’02
’01
’00
’99
Operating Income (Loss)
(Billions of Yen)
Operating Income (Loss) Major Products & Services