World Fuel Services 2002 Annual Report Download - page 3
Download and view the complete annual report
Please find page 3 of the 2002 World Fuel Services annual report below. You can navigate through the pages in the report by either clicking on the pages listed below, or by using the keyword search tool below to find specific information within the annual report.-
 1
1 -
 2
2 -
 3
3 -
 4
4 -
 5
5 -
 6
6 -
 7
7 -
 8
8 -
 9
9 -
 10
10 -
 11
11 -
 12
12 -
 13
13 -
 14
14 -
15
-
16
-
17
-
18
-
19
-
20
-
21
-
22
-
23
-
24
-
25
-
26
-
27
-
28
-
29
-
30
-
31
-
32
-
33
-
34
-
35
-
36
-
37
-
38
-
39
-
40
-
41
-
42
-
43
-
44
-
45
-
46
-
47
-
48
-
49
-
50
-
51
-
52
-
53
-
54
-
55
-
56
-
57
-
58
-
59
-
60
-
61
-
62
-
63
-
64
-
65
-
66
-
67
-
68
-
69
-
70
-
71
-
72
-
73
-
74
-
75
-
76
-
77
-
78
-
79
-
80
-
81
-
82
-
83
-
84
 |
 |

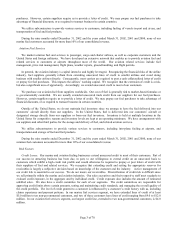
Financial Highlights
As of, and for the Nine Months
Ended December 31, As of, and for the Year Ended March 31,
2002 2001 Change 2002 2001 2000
(In thousands, except earnings per share data and financial ratios)
Income Statement Data
Revenue $1,546,897 $1,013,781 52.6% $1,365,065 $1,529,242 $1,200,297
Income from operations 13,786 *14,906 (7.5)% 21,289 14,152 6,918
Net income 9,872 ** 12,762 ** * (22.6)% 17,235 10,634 9,635
Diluted earnings per share $ 0.91 * * $ 1.20 *** (24.2)% $ 1.62 $1.00 $0.80
Weighted average shares diluted 10,900 10,652 2.3% 10,646 10,663 12,045
Balance Sheet Data
Total assets $ 312,287 $ 209,693 $ 257,923 $ 222,165 $ 227,915
Stockholders’ equity 127,730 113,792 116,439 103,860 99,661
Financial Ratios
Book value per share $11.94 $10.88 $11.22 $9.98 $9.06
Current ratio 1.5 1.9 1.6 1.7 1.6
Debt/equity ratio 4.6% 5.3% 8.6% 5.3% 3.0%
Return on assets 4.6% 7.7% 7.6% 4.8% 4.8%
Return on equity 11.0% 15.7% 15.7% 10.5% 9.5%
’01 ’02
$1,013.8
$1,546.9
$209.7
$312.3
$12.8
$9.9
Revenue
(in millions)
’01*** ’02**
Net Income
(in millions)
’01 ’02
Total Assets
(in millions)
Stockholders’
Equity
(in millions)
’01 ’02
1
*Includes non-recurring executive severance charges of $4.5 million.
** Includes two non-recurring, after-tax charges totaling $3.7 million, or $0.34 per diluted share, relating to executive severances and judgment settlement.
** * Includes the receipt of $1.0 million, or $0.09 per diluted share, from an insurance settlement recovery related to a product theft off the coast of Nigeria in 1999.
Nine-Month Results
$127.7
$113.8