Windstream 2012 Annual Report Download - page 107
Download and view the complete annual report
Please find page 107 of the 2012 Windstream annual report below. You can navigate through the pages in the report by either clicking on the pages listed below, or by using the keyword search tool below to find specific information within the annual report.-
 1
1 -
2
-
3
-
4
-
5
-
6
-
7
-
8
-
9
-
10
-
11
-
12
-
13
-
14
-
15
-
16
-
17
-
18
-
19
-
20
-
21
-
22
-
23
-
24
-
25
-
26
-
27
-
28
-
29
-
30
-
31
-
32
-
33
-
34
-
35
-
36
-
37
-
38
-
39
-
40
-
41
-
42
-
43
-
44
-
45
-
46
-
47
-
48
-
49
-
50
-
51
-
52
-
53
-
54
-
55
-
56
-
57
-
58
-
59
-
60
-
61
-
62
-
63
-
64
-
65
-
66
-
67
-
68
-
69
-
70
-
71
-
72
-
73
-
74
-
75
-
76
-
77
-
78
-
79
-
80
-
81
-
82
-
83
-
84
-
85
-
86
-
87
-
88
-
89
-
90
-
91
-
92
-
93
-
94
-
95
-
96
-
 97
97 -
 98
98 -
 99
99 -
 100
100 -
 101
101 -
 102
102 -
 103
103 -
 104
104 -
 105
105 -
 106
106 -
 107
107 -
 108
108 -
 109
109 -
 110
110 -
 111
111 -
 112
112 -
 113
113 -
 114
114 -
 115
115 -
 116
116 -
 117
117 -
118
-
119
-
120
-
121
-
122
-
123
-
124
-
125
-
126
-
127
-
128
-
129
-
130
-
131
-
132
-
133
-
134
-
135
-
136
-
137
-
138
-
139
-
140
-
141
-
142
-
143
-
144
-
145
-
146
-
147
-
148
-
149
-
150
-
151
-
152
-
153
-
154
-
155
-
156
-
157
-
158
-
159
-
160
-
161
-
162
-
163
-
164
-
165
-
166
-
167
-
168
-
169
-
170
-
171
-
172
-
173
-
174
-
175
-
176
-
177
-
178
-
179
-
180
-
181
-
182
-
183
-
184
-
185
-
186
-
187
-
188
-
189
-
190
-
191
-
192
-
193
-
194
-
195
-
196
 |
 |

F-9
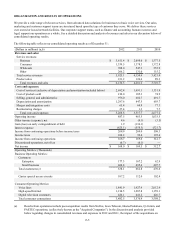
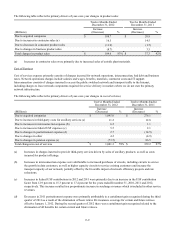
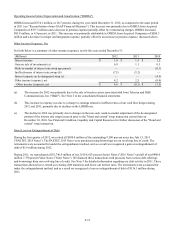
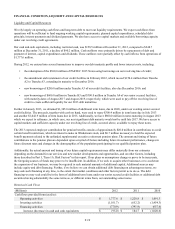
The following table reflects the primary drivers of year-over-year changes in product sales:
Twelve Months Ended
December 31, 2012
Twelve Months Ended
December 31, 2011
(Millions)
Increase
(Decrease) %
Increase
(Decrease) %
Due to acquired companies $ 108.7 $ 20.8
Due to increases in contractor sales (a) 16.5 14.5
Due to decreases in consumer product sales (11.9)(1.5)
Due to changes in business product sales (8.7) 3.5
Total changes in product sales $ 104.6 83% $ 37.3 42%
(a) Increases in contractor sales were primarily due to increased sales of outside plant materials.
Cost of Services
Cost of services expense primarily consists of charges incurred for network operations, interconnection, bad debt and business
taxes. Network operations charges include salaries and wages, benefits, materials, contractor costs and IT support.
Interconnection consists of charges incurred to access the public switched network and transport traffic to the Internet,
including charges to lease network components required for service delivery in markets where we do not own the primary
network infrastructure.
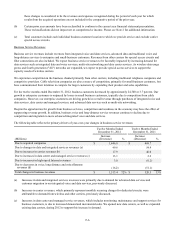
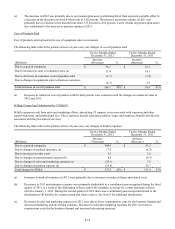
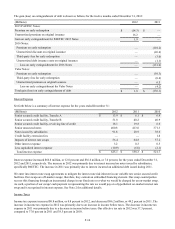
The following table reflects the primary drivers of year-over-year changes in cost of services:
Twelve Months Ended
December 31, 2012
Twelve Months Ended
December 31, 2011
(Millions)
Increase
(Decrease) %
Increase
(Decrease) %
Due to acquired companies $ 1,045.0 $ 276.1
Due to increases in third-party costs for ancillary services (a) 11.2 12.8
Due to increases in interconnection expense (b) 6.2 1.1
Due to increases in federal USF expenses (c) 5.5 2.1
Due to changes in postretirement expense (d) 2.7 (14.5)
Due to changes in other 4.2 (4.9)
Due to changes in pension expense (e) (73.5) 86.5
Total changes in cost of services $ 1,001.3 59% $ 359.2 27%
(a) Increases in charges incurred to provide third-party services driven by sales of ancillary products as well as costs
incurred for product offerings.
(b) Increases in interconnection expense were attributable to increased purchases of circuits, including circuits to service
the growth in data customers, as well as higher capacity circuits to service existing customers and increase the
transport capacity of our network, partially offset by the favorable impact of network efficiency projects and rate
reductions.
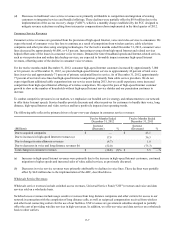
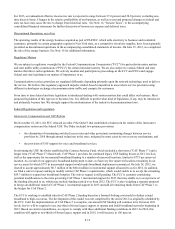
(c) Increases in federal USF contributions in 2012 and 2011 were primarily due to an increase in the USF contribution
factor from 12.9 percent to 15.3 percent to 17.4 percent for the years ended December 31, 2010, 2011 and 2012,
respectively. This increase resulted in a proportionate increase in surcharge revenues which is included in other service
revenues.
(d) Decreases in 2011 postretirement expense were primarily attributable to a curtailment gain recognized during the third
quarter of 2011 as a result of the elimination of basic retiree life insurance coverage for certain and future retirees
effective January 1, 2012. During the second quarter of 2012 there was a curtailment gain recognized related to the
elimination of all benefits for certain current and future retirees.