Windstream 2009 Annual Report Download - page 179
Download and view the complete annual report
Please find page 179 of the 2009 Windstream annual report below. You can navigate through the pages in the report by either clicking on the pages listed below, or by using the keyword search tool below to find specific information within the annual report.-
 1
1 -
2
-
3
-
4
-
5
-
6
-
7
-
8
-
9
-
10
-
11
-
12
-
13
-
14
-
15
-
16
-
17
-
18
-
19
-
20
-
21
-
22
-
23
-
24
-
25
-
26
-
27
-
28
-
29
-
30
-
31
-
32
-
33
-
34
-
35
-
36
-
37
-
38
-
39
-
40
-
41
-
42
-
43
-
44
-
45
-
46
-
47
-
48
-
49
-
50
-
51
-
52
-
53
-
54
-
55
-
56
-
57
-
58
-
59
-
60
-
61
-
62
-
63
-
64
-
65
-
66
-
67
-
68
-
69
-
70
-
71
-
72
-
73
-
74
-
75
-
76
-
77
-
78
-
79
-
80
-
81
-
82
-
83
-
84
-
85
-
86
-
87
-
88
-
89
-
90
-
91
-
92
-
93
-
94
-
95
-
96
-
97
-
98
-
99
-
100
-
101
-
102
-
103
-
104
-
105
-
106
-
107
-
108
-
109
-
110
-
111
-
112
-
113
-
114
-
115
-
116
-
117
-
118
-
119
-
120
-
121
-
122
-
123
-
124
-
125
-
126
-
127
-
128
-
129
-
130
-
131
-
132
-
133
-
134
-
135
-
136
-
137
-
138
-
139
-
140
-
141
-
142
-
143
-
144
-
145
-
146
-
147
-
148
-
149
-
150
-
151
-
152
-
153
-
154
-
155
-
156
-
157
-
158
-
159
-
160
-
161
-
162
-
163
-
164
-
165
-
166
-
167
-
168
-
 169
169 -
 170
170 -
 171
171 -
 172
172 -
 173
173 -
 174
174 -
 175
175 -
 176
176 -
 177
177 -
 178
178 -
 179
179 -
 180
180 -
 181
181 -
 182
182 -
 183
183 -
 184
184 -
 185
185 -
 186
186 -
 187
187 -
 188
188 -
 189
189 -
190
-
191
-
192
-
193
-
194
-
195
-
196
 |
 |

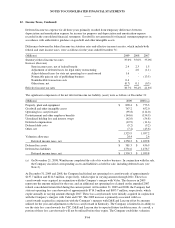
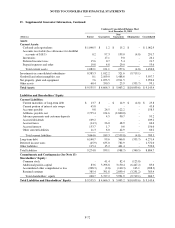
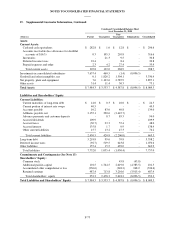
NOTES TO CONSOLIDATED FINANCIAL STATEMENTS
11. Comprehensive Income:
Comprehensive income was as follows for the years ended December 31:
(Millions) 2009 2008 2007
Net income $ 334.5 $ 412.7 $ 917.1
Other comprehensive income (loss):
Defined benefit pension plans:
Prior service cost arising during the period - (0.2) (0.1)
Net actuarial gain (loss) arising during the period 44.5 (394.9) 36.0
Amounts included in net periodic benefit cost:
Amortization of net actuarial loss 71.1 6.1 24.1
Amortization of prior service credit (0.2) (0.1) (0.2)
Income tax benefit (expense) (44.3) 148.0 (23.5)
Change in pension plan 71.1 (241.1) 36.3
Postretirement plan:
Transition asset arising during the period - 3.5 -
Prior service credit (cost) arising during the period 54.8 48.6 (1.0)
Net actuarial gain arising during the period 11.0 8.8 53.6
Amounts included in net periodic benefit cost:
Amortization of transition obligation - 0.5 0.8
Amortization of net actuarial loss - 1.1 6.1
Amortization of prior service cost (3.2) 0.2 1.9
Income tax expense (25.8) (16.1) (24.3)
Change in postretirement plan 36.8 46.6 37.1
Change in employee benefit plans 107.9 (194.5) 73.4
Interest rate swaps:
Unrealized holding gain (loss) on interest rate swaps 33.6 (63.8) (40.8)
Income tax benefit (13.2) 24.7 15.2
Unrealized holding gain (losses) on interest rate swaps 20.4 (39.1) (25.6)
Comprehensive income $ 462.8 $ 179.1 $ 964.9
Accumulated other comprehensive loss balances, net of tax, were as follows for the years ended December 31:
(Millions) 2009 2008 2007
Pension and postretirement plans $ (140.4) $ (248.3) $ (53.8)
Unrealized holding losses on interest rate swaps (67.9) (88.3) (49.2)
Accumulated other comprehensive loss $ (208.3) $ (336.6) $ (103.0)
12. Income Taxes:
Income tax expense was as follows for the years ended December 31:
(Millions) 2009 2008 2007
Current:
Federal $ 120.2 $ 136.8 $ 198.1
State and other 10.8 30.4 23.7
131.0 167.2 221.8
Deferred:
Federal 57.4 98.9 46.7
State and other 22.7 17.1 (17.0)
80.1 116.0 29.7
Income tax expense $ 211.1 $ 283.2 $ 251.5
F-65