Whole Foods 2010 Annual Report Download - page 12
Download and view the complete annual report
Please find page 12 of the 2010 Whole Foods annual report below. You can navigate through the pages in the report by either clicking on the pages listed below, or by using the keyword search tool below to find specific information within the annual report.-
 1
1 -
 2
2 -
 3
3 -
 4
4 -
 5
5 -
 6
6 -
 7
7 -
 8
8 -
 9
9 -
 10
10 -
 11
11 -
 12
12 -
 13
13 -
 14
14 -
 15
15 -
 16
16 -
 17
17 -
 18
18 -
 19
19 -
 20
20 -
 21
21 -
 22
22 -
23
-
24
-
25
-
26
-
27
-
28
-
29
-
30
-
31
-
32
-
33
-
34
-
35
-
36
-
37
-
38
-
39
-
40
-
41
-
42
-
43
-
44
-
45
-
46
-
47
-
48
-
49
-
50
-
51
-
52
-
53
-
54
-
55
-
56
-
57
-
58
-
59
-
60
-
61
-
62
-
63
-
64
-
65
-
66
-
67
-
68
 |
 |

6
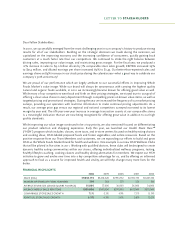
Our historical store growth and sales mix is summarized below:
2010 2009 2008 2007 2006
Stores at beginning of fiscal year 284 275 276 186 175
Stores opened 16 15 20 21 13
Acquired stores 2 - - 109 1
Divested stores (2) - - (35) -
Relocated stores - (5) (7) (5) (2)
Closed stores (1) (1) (14) - (1)
Stores at end of fiscal year 299 284 275 276 186
Remodels with major expansions1 - 2 1 2 1
Total gross square footage at end of fiscal year 11,231,000 10,566,000 9,895,000 9,312,000 6,377,000
Year-over-year growth 6% 7% 6% 46% 10%
Sales mix:
Identical stores 93.2% 91.4% 80.9% 88.8% 90.4%
New/relocated stores and remodels with major expansions 6.0% 7.8% 9.9% 8.4% 8.8%
Acquired stores 0.1% 0.0% 8.7% 1.3% 0.1%
Other sales, primarily non-retail external sales 0.7% 0.8% 0.5% 1.5% 0.7%
Total sales 100.0% 100.0% 100.0% 100.0% 100.0%
1 Defined as remodels with expansions of square footage greater than 20% completed during the fiscal year.
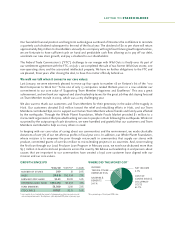
We remain focused on the right sized store for each market. In response to overall economic conditions, we trimmed
approximately 1.4 million square feet from our development pipeline. Over the last two and a half years, we downsized 20
leases for stores in development by an average of 13,000 square feet each, and we terminated 22 leases averaging 52,000
square feet per store. We are now focused on rebuilding the pipeline given the improvement in the economy, our strong new
store performance, and the favorable rent opportunities we are seeing. We anticipate an accelerated pace of lease signings in
the future to translate into a higher number of store openings starting in fiscal year 2012. Our historical store development
pipeline is summarized below:
November 3, November 4, November 5, November 20, November 2,
2010 2009 2008 2007 2006
Stores in development 52 53 66 87 88
Average size (gross square feet) 39,000 45,000 49,000 51,000 56,000
Total gross square footage in development 2,052,000 2,410,000 3,294,000 4,485,000 5,003,000
Store Description
Each of our stores is designed to fit the size and configuration of the particular location and to reflect the community in
which it is located. We strive to transform food shopping from a chore into a dynamic experience by building and operating
stores with colorful décor, well-trained team members, an exciting product mix that emphasizes healthy eating and our high
quality standards, ever-changing selections, samples, open kitchens, scratch bakeries, hand-stacked produce, and prepared
foods stations. We also incorporate many environmentally sustainable aspects into our store design. Our stores typically
include sit-down eating areas, customer comment boards and customer service booths. In addition, some stores offer special
services such as massage, valet parking, personal shopping and home delivery. We believe our stores play a unique role as a
third place, besides the home and office, where people can gather, interact and learn while at the same time discovering the
many joys of eating and sharing food.
Most of our stores are located in high-traffic shopping areas on premier real estate sites and are either freestanding or in strip
centers. We also have a number of urban stores located in high-density, mixed-use developments. In selecting store locations,
we use an internally developed model to analyze potential sites based on various criteria such as education levels, population
density and income levels within certain drive times. After we have selected a target site, our development group does a
comprehensive site study and sales projection. Each project must meet an internal EVA hurdle return based on a 9%
weighted average cost of capital, which for new stores generally is expected to be cumulative positive EVA in five years or
less.
The required cash investment for new stores varies depending on the size of the store, geographic location, degree of work
performed by the landlord and complexity of site development issues. To a significant degree, it also depends on how the
project is structured, including costs for elements that often increase or decrease rent, e.g., lease acquisition costs, shell
and/or garage costs, and landlord allowances. For stores opened during fiscal year 2010, the average size was 42,600 square
feet, and the average new store investment was approximately $11.1 million, or $261 per square foot. This excludes new
store inventory of approximately $0.9 million and pre-opening and relocation expenses, which averaged approximately $2.6