Whole Foods 2010 Annual Report Download - page 11
Download and view the complete annual report
Please find page 11 of the 2010 Whole Foods annual report below. You can navigate through the pages in the report by either clicking on the pages listed below, or by using the keyword search tool below to find specific information within the annual report.-
 1
1 -
 2
2 -
 3
3 -
 4
4 -
 5
5 -
 6
6 -
 7
7 -
 8
8 -
 9
9 -
 10
10 -
 11
11 -
 12
12 -
 13
13 -
 14
14 -
 15
15 -
 16
16 -
 17
17 -
 18
18 -
 19
19 -
 20
20 -
 21
21 -
 22
22 -
23
-
24
-
25
-
26
-
27
-
28
-
29
-
30
-
31
-
32
-
33
-
34
-
35
-
36
-
37
-
38
-
39
-
40
-
41
-
42
-
43
-
44
-
45
-
46
-
47
-
48
-
49
-
50
-
51
-
52
-
53
-
54
-
55
-
56
-
57
-
58
-
59
-
60
-
61
-
62
-
63
-
64
-
65
-
66
-
67
-
68
 |
 |
5
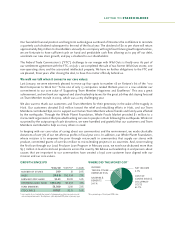
and we have developed a grouping of “exclusive” and “control brand” products to fill out our family of brands. Total sales of
store-branded products across all categories were approximately 11% of our retail sales in both fiscal years 2010 and 2009.
Whole TradeTM Guarantee
Whole Trade Guarantee products meet our high quality standards; provide more money to producers; ensure better wages
and working conditions for workers; and utilize sound environmental practices. Our Whole Trade Guarantee program
currently includes over 1,400 items, with sales of approximately $114.3 million in fiscal year 2010. Whole Foods Market
donates 1% of sales of exclusive Whole Trade Guarantee products to the Whole Planet Foundation® to help alleviate world
poverty.
Locally Grown
We are committed to buying from local producers whose products meet our high quality standards, particularly those who
are dedicated to environmentally friendly, sustainable agriculture. Whole Foods Market currently purchases produce from
over 2,000 different farms through various suppliers. In 2007, we established a budget of up to $10 million to promote local
food production, and as of September 26, 2010, we had disbursed more than $3.7 million in loans to 66 local producers
Company-wide.
Animal Compassionate
We are dedicated to promoting animal welfare on farms and ranches that raise animals for meat production, helping to create
alternatives to the “factory farm” methods of raising livestock. We have encouraged innovative animal production practices
to improve the quality and safety of the meat and poultry sold in our stores while also supporting humane living conditions
for the animals. Work on our “animal compassionate” standards started in 2003, and additional standards development and
implementation of a 5-Step Animal Welfare Rating system transitioned to the Global Animal Partnership foundation in 2008.
Global Animal Partnership’s 5-Step Animal Welfare Rating standards have been developed for beef cattle, pigs and broiler
chickens and are in the works for other species as well. By February 2011, our meat departments in all stores will reflect
these certifications.
Sustainable Seafood
In September 2010, we completed the launch of a color-coded, science-based seafood sustainability ratings program
developed by partnering organizations, Blue Ocean Institute and Monterey Bay Aquarium. The new program rates non-MSC
certified wild-caught seafood based on key criteria for sustainable fisheries with solid, transparent ranking methods. The
ratings provide customers with the information they need to make informed decisions about their seafood purchases, and
with our promise to phase out all “red-rated” species by Earth Day 2013, we have deepened our commitment to having fully
sustainable seafood departments. This new seafood ratings program builds upon our ongoing partnership with the Marine
Stewardship Council (“MSC”) and complements Whole Foods Market’s existing farmed seafood standards, which remain
the highest in the industry. Farmed seafood at Whole Foods Market carries the “Responsibly Farmed” logo to indicate that it
meets these high standards.
Seasonality
The Company’s average weekly sales are typically highest in the second and third fiscal quarters and lowest in the fourth
fiscal quarter. Gross profit is typically lower in the first fiscal quarter due to the product mix of holiday sales, and in the
fourth fiscal quarter due to the seasonally slower sales period during the summer months.
Growth Strategy
We are a Fortune 500 company, ranking number 284 on the 2010 list. Our sales have grown rapidly due to historically high
identical store sales growth, acquisitions, and new store openings from approximately $92.5 million in fiscal year 1991,
excluding the effect of pooling-of-interests transactions completed since 1991, to approximately $9.01 billion in fiscal year
2010, a compounded annual growth rate of approximately 27%.
Over the last 10 years, our identical store sales growth has averaged approximately 7%. Approximately 21% of our existing
square footage was acquired, and while we may continue to pursue acquisitions of smaller chains that provide access to
desirable areas and experienced team members, such acquisitions are not expected to significantly impact our future store
growth or financial results. Our growth strategy is to expand primarily through new store openings. We have a disciplined,
opportunistic real estate strategy, opening stores in existing trade areas as well as new areas, including international
locations. Our new stores typically are located on premium real estate sites and range in size between 35,000 and 50,000
square feet which we believe is appropriate in most circumstances to maximize return on invested capital and Economic
Value Added (“EVA®”). We expect the majority of our stores to fall within this range going forward. In its simplest
definition, EVA is equivalent to net operating profits after taxes minus a charge on the cost of invested capital necessary to
generate those profits.