Whole Foods 2007 Annual Report Download - page 5
Download and view the complete annual report
Please find page 5 of the 2007 Whole Foods annual report below. You can navigate through the pages in the report by either clicking on the pages listed below, or by using the keyword search tool below to find specific information within the annual report.-
 1
1 -
 2
2 -
 3
3 -
 4
4 -
 5
5 -
 6
6 -
 7
7 -
 8
8 -
 9
9 -
 10
10 -
 11
11 -
 12
12 -
 13
13 -
 14
14 -
 15
15 -
 16
16 -
17
-
18
-
19
-
20
-
21
-
22
-
23
-
24
-
25
-
26
-
27
-
28
-
29
-
30
-
31
-
32
-
33
-
34
-
35
-
36
-
37
-
38
-
39
-
40
-
41
-
42
-
43
-
44
-
45
-
46
-
47
-
48
-
49
-
50
-
51
-
52
-
53
-
54
-
55
-
56
-
57
-
58
-
59
-
60
-
61
-
62
-
63
-
64
-
65
-
66
-
67
-
68
-
69
-
70
-
71
-
72
-
73
-
74
-
75
-
76
 |
 |

o Buying Global. In March, we launched our
Whole Trade™ program, a new buying initiative
that brings together a set of strict criteria
for products from developing countries to
ensure: exceptional product quality; more
money for producers; better wages and working
conditions; sound environmental production
practices; and support for eliminating poverty
through a donation of 1% of sales to our
Whole Planet Foundation™. The Whole
Trade Guarantee label is currently featured
on over 400 items, and sales of $8 million
to date have generated close to $80,000 in
donations to the Whole Planet Foundation.
Our goal is to have over 50% of our imported
products from the developing world meet our
Whole Trade qualifications within 10 years.
o Five-Step Animal Welfare Rating Program. With
the opening of our new London store in June,
we debuted our five-tiered meat and poultry
labeling program which provides shoppers
with a clear and transparent way to make
informed buying decisions based solely on
animal welfare considerations. We hope to roll
out the program in our U.S. stores in 2008.
Above and beyond offering the highest quality
natural and organic products, we are also
known for our emphasis on perishables,
beautiful stores uniquely designed for each
market, and exceptional customer service,
which all translate into a fun shopping
experience that is hard to replicate.
We support Team Member happiness and
excellence and were very pleased to have earned
the No. 16 spot on FORTUNE’s annual list of
the “100 Best Companies to Work For.” We are
one of only 14 companies to be ranked every
year since the list’s inception 11 years ago.
In keeping with our core value of caring about
our communities and the environment, we made
charitable donations of just under $15 million,
or about 8% of our after-tax profits in fiscal year
2007. In addition, our Whole Planet Foundation,
which seeks to create economic partnerships with
the poor in the developing-world communities
that supply our stores with product, committed
over $5 million in grants to five micro-lending
projects in five countries: Costa Rica, Guatemala,
Nicaragua, Honduras and India. We hope
to expand to Indonesia, Kenya and Tanzania
in 2008. For our commitment to advancing
the development of the nation’s green power
market, we were awarded the Environmental
Protection Agency’s Green Power Partner of
the Year award for a second consecutive year.
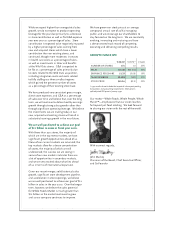
Our business model is very successful and
continues to benefit all of our stakeholders.
We are executing at a high level, continuing to
produce higher sales growth, comparable store
sales increases and sales per square foot than
our public competitors. In fiscal year 2008,
we expect higher-than-average sales growth of
25% to 30%, of which approximately 10% is
expected to come from the Wild Oats stores, and
comparable store sales growth of 7.5% to 9.5%.
We believe we will return to our more historical
comparable stores sales growth rate despite
increasing competition, a greater degree of
cannibalization, and the possible negative
impact of any slowdown in consumer spending.
Our expectation is based on our continued
positive sales growth trends along with
easier year-over-year comparisons, a greater
number of new stores entering the comparable
store base, and the transfer of sales from
some of the Wild Oats’ store closures.
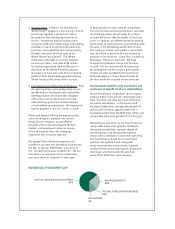
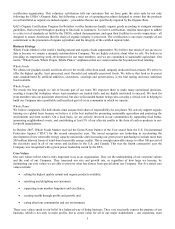
COST OF GOODS SOLD/OCCUPANCY
63% SALARIES/BENEFITS
24%
INCOME TAXES/OTHER EXPENSES
10%
NET INCOME
3%
WHERE DID THE MONEY GO?