Western Digital 2011 Annual Report Download - page 4
Download and view the complete annual report
Please find page 4 of the 2011 Western Digital annual report below. You can navigate through the pages in the report by either clicking on the pages listed below, or by using the keyword search tool below to find specific information within the annual report.-
 1
1 -
 2
2 -
 3
3 -
 4
4 -
 5
5 -
 6
6 -
 7
7 -
 8
8 -
 9
9 -
 10
10 -
 11
11 -
 12
12 -
 13
13 -
 14
14 -
 15
15 -
16
-
17
-
18
-
19
-
20
-
21
-
22
-
23
-
24
-
25
-
26
-
27
-
28
-
29
-
30
-
31
-
32
-
33
-
34
-
35
-
36
-
37
-
38
-
39
-
40
-
41
-
42
-
43
-
44
-
45
-
46
-
47
-
48
-
49
-
50
-
51
-
52
-
53
-
54
-
55
-
56
-
57
-
58
-
59
-
60
-
61
-
62
-
63
-
64
-
65
-
66
-
67
-
68
-
69
-
70
-
71
-
72
-
73
-
74
-
75
-
76
-
77
-
78
-
79
-
80
-
81
-
82
-
83
-
84
-
85
-
86
-
87
-
88
-
89
-
90
-
91
-
92
-
93
-
94
-
95
-
96
-
97
-
98
-
99
-
100
 |
 |

We believe there are a number of reasons why the next few
years could be a stronger period for the industry and for WD
because of:
• the potential for an acceleration of the commercial
PC refresh as part of an overall macro
reinvestment cycle;
• the potential for better consumer condence
translating into stronger discretionary spending;
• the planned launch of redesigned, feature-rich
PCs enabled by Windows® 8; and
• our continued favorable standing with customers
as one of the preferred suppliers of the world’s
most cost–effective storage solutions for the
massive amounts of content being generated on
the client and in the cloud.
In this context, it’s important to consider some history. Through-
out scal 2011, we operated close to the bottom of our business
model range. Others in the industry struggled even more,
reporting results below their published models. Historical cycles
show that prolonged periods of below-model performance are
typically followed by a return to business model parameters as
suppliers and customers alike recognize the need for industry
protability to drive needed investments in both technology and
capacity. WD has repeatedly outperformed as these cyclical
corrections occur.
On the other hand, with the industry’s lowest cost structure and a
demonstrated ability to adjust our operations quickly and adroitly
to changing market conditions, we are prepared to deal with a
slower growth environment if this comes to pass.
Our focus on excellence in operations, exibility and execution
has been key to our success. In scal 2011, the WD team and
our suppliers performed well as we navigated through the supply
chain disruptions stemming from the unfortunate events in
Japan and a shift in demand patterns due to changes in freight
practices from air to sea by our customers.
For the longer term, we remain optimistic in the growth prospects
of our industry as the proliferation of digital content and data
continues unabated, along with the need to store, protect
and display it. In scal 2011, we took a major strategic step
to strengthen our position as a leading player in the industry
with our announced plan to acquire Hitachi Global Storage
Technologies (HGST), the hard drive division of Hitachi, Ltd. We
believe the HGST acquisition will be good for competition and
$0
$500
$1,000
$1,500
$2,000
$2,500
$3,000
$3,500
FY2007 FY2008 FY2009 FY2010 FY2011
$2,334
$3,196
$678 $595
$1,312
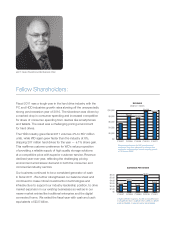
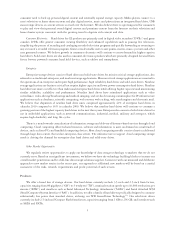
NET CASH
Dollars in millions
Net cash (cash and cash equivalents less debt)
ended the year at $3.2 billion, up $862 million from
the end of scal 2010.
$0
$200
$400
$600
$800
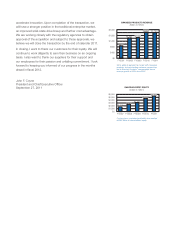
CAPITAL EXPENDITURES
Dollars in millions
$324
$615 $737 $778
$519
FY2007 FY2008 FY2009 FY2010 FY2011
Capital expenditures continue to increase as
we invest in manufacturing and development
capabilities to support our future growth.
$0
$200
$400
$600
$800
$1,000
$1,200
$1,400
$1,600
$1,800
$2,000
CASH FLOW FROM OPERATIONS
$1,305
$1,655
$1,399
$1,942
Dollars in millions
$618
FY2007 FY2008 FY2009 FY2010 FY2011
Strong protability and disciplined balance sheet
management generated $1.7 billion in cash ow
from operations during 2011.
$0
$200
$400
$600
$800
FY2007 FY2008 FY2009 FY2010 FY2011
RESEARCH and DEVELOPMENT SPENDING
Dollars in millions
$306
$464
$611 $703
$509
Research and development continues to increase
as we invest in new products and technology that
will support the growing demand for electronic
data storage management.